


ENERGIZED: Investment Insights on Energy Transformation
Edition 12
Unstoppable Momentum: The Accelerating Energy Transformation
15 October 2025
Please note: This newsletter is for general informational purposes only and should not be construed as financial, legal or tax advice nor as an invitation or inducement to engage in any specific investment activity, nor to address the specific personal requirements of any readers. (Full disclaimer below).
Key Takeaways:
We often hear that the energy transition is slowing down. In fact, the latest data reflect critical velocity towards systemic tipping points. As energy technology disruption compounds and spreads globally, we are living through a historically rapid transformation.
Financial markets recognise this. Critical power and grid equipment providers have surged in value, as accelerating power and transmission demand deepens supply chain backlogs. Despite political headwinds, clean energy stocks have outperformed over the past 6 months, albeit many look vulnerable to an AI downturn.
Global electrification of transport and heat and growth in space cooling, not US data centres, will be the primary power demand drivers. That implies robust longer-term demand for critical power equipment beyond any nearer-term correction.
The Petrostate/Electrostate divergence between the US and China, with their radically divergent energy strategies, belies a deeper convergence towards the electrification model, given its clear economic and security advantages. Reactionary US policies grab the headlines but even there, solar and batteries are dominating new supply, as speed to power is critical. Meanwhile, everywhere else benefits from increasingly affordable Chinese energy equipment.
Meanwhile, the global adoption of renewables and flexibility continues to accelerate towards a world of rapidly-installed, gigascale, clean, firm elecricity usage. Solar disruption is arriving across developing markets. EV monthly sales hit 2 million in September, up 26% year on year. But it’s batteries where the next energy revolution is unfolding, driven by strong innovation and competition. With pack costs down 90% since 2010 and capacity is rising by two thirds to ~617 GWh this year alone, batteries are heading for 10x growth by 2035.
The fossil demand impact is already clear: 1.3 mbd oil displaced in 2024, 1.8 mbd expected this year, likely rising to ~10 mbd by 2035 as rising EV sales eat into ICE market share. It’s hardly contrarian by now to point out that the oil and gas markets are heading for prolonged slumps, as rising supply gets pushed into weak demand. Battery-powered flexibility looks increasingly disruptive to global gas demand.
Relentless advance
Energized is back after some time away dealing with competing responsibilities. As we head deeper into the fourth quarter, we turn our attention back to the rapid and exciting changes underway across the global energy space, changes that you might be forgiven for missing if you only catch headlines about spurious cancellation of wind projects in the US. Driven by a relentless focus on US policy moves, the “slower transition” narrative is still hanging on despite overwhelming evidence.
In fact, energy news has been like a treadmill locked on sprint speed. Indispensable new data has piled up into a critical overload of open browser tabs. How to keep up with it all let alone distill it all into coherent analysis?
The answer is, of course, to treat it all like a flowing menu and just pick some highlights. So, into this gushing river of evidence, we attempted below to dip our humble water bottle, to take a sample of compelling energy charts of recent months and give a sense of the key dynamics.
Let’s start with global energy investment flows and their evolution over the past decade.

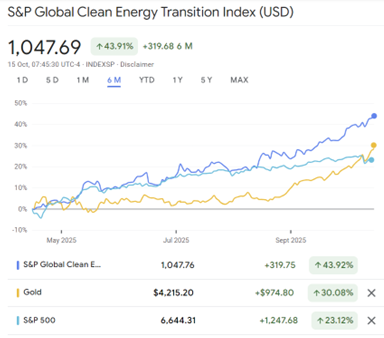
S&P Global Clean Energy and S&P 500 indices vs Gold, relative performance last 6 months to 15 October 2025. Source: Google
Global energy investment evolution, 2015-25. Source: IEA
To see the future, follow the money
This eye-catching IEA graphic has one clear message: clean energy expenditure (including grids) is now double that of fossil fuels, at $2.2 trillion vs $1.1 trillion annually, from roughly equal a decade ago. Oil expenditure has fallen by a third in that time, and gas by just under 20%. Meanwhile, both renewables and electrification spend have more than doubled, grids and storage have risen by around 45% and energy efficiency is also up by around half. Coal investment actually increased marginally (although coal for power generation expenditure is actually slightly down) and nuclear is also up but remains relatively marginal. Within that renewables band, solar has roughly tripled, while battery storage has gone from zero to $66 billion, and rising fast.
As the figures are in 2024 USD, they do not reflect the fact that $1 billion spent in 2025 buys significantly more solar panels and batteries that it did in 2015. Nor does it illustrate that $1 billion spent on that hardware today can continually harness electricity for three decades, rather than providing energy via one-off combustion that needs to be continually replaced, as for coal, oil and gas.
A decade from now, the clean:fossil spend ratio will undoubtedly be much higher than 2:1. Given the denominator is likely to fall as coal and oil demand peak, and the gas market is about to enter years of heavy oversupply, 5:1 or even 10:1 doesn’t seem far-fetched. It’s also likely that the imbalance between reneable generation capacity ($1 trillion), grid capacity investments ($400 billion) and storage (a mere $66 billion) will start to even out, enabling clean generation to achieve greater reach and flexibility.
The other rebalancing will be a geographical one. A disproportionate amount of the clean energy investment today is in China. We expect that to ripple out more evenly across the rest of the world over come years thanks to the compelling energy security and economic logic of importing Chinese clean energy infrastructure.
So where will this increasing investment in renewables, grids and storage take us? That’s right: into the Age of Electricity.

Historical and projected electricity demand growth as a proportion of energy demand growth. Source: IEA
This includes big names mentioned before like Siemens Energy and GE Vernova, which have benefitted from the AI-driven scramble for power in the US. Other companies like Bloom Energy, ESS and EOS Enterprises have gone ballistic for related reasons. Undoubtedly, there is one major contributing factor here: the AI capex boom - or bubble, depending on your viewpoint. In the words of a Reuters analysis last week, suddenly “every electron counts” as access to power becomes ever more indispensible for hyperscalers fixated on winning the AI race. By the same token, this leaves some energy tech and equipment companies exposed to the much-anticipated bursting of the AI bubble.
In any case, the electrification supply chain is running well behind the surge in demand - real or anticipated - at this stage. HVDC-focused cable manufacturers Nexans and NKT have been the top two performers in the Energized portfolio, rising more around 45% and 65% respectively at the time of writing since we invested in early April.
That inevitably raises the question: how long can that momentum continue? Will the supply chain catch up with demand as it expands capacity? Is this high demand already priced in following big valuation upgrades? Will energy efficiency impact AI power demand growth more than most people realise? Or are we still in the foothills of a critical electrical equipment supercycle? We will be continually returning to these questions over the coming months.
But there is more going on here than just the AI frenzy. Although data centres will play a bigger relative role in the US, globally they are not the main driver of new electricity demand. The deeper structural shift towards electrification of transport and heat across industry and building, as well as space cooling, will be bigger drivers of demand for cables, electrical equipment and flexibility software. As the marginal power supply is increasingly met by solar and wind, increasingly supported by batteries, this creates a chain reaction of demand for supporting infrastructure and components. And that wave of solar and batteries is about to get much bigger…

Cable and transformer price index, 2018-25. Source: IEA
Electrification: the race is on
Electrification, more than renewables, will be the fundamental lever of energy transformation. Electricity demand is now rising by around 4% annually, much faster than before and faster than total energy demand. That is expected to accelerate further with the continued rise of EVs, electrified heating and cooling, plus the growth of data centres.
Consider the implications of this chart: based on today’s policy settings, electricity demand growth would outpace energy demand growth 6x up to 2035. That implies a rapid acceleration in electrification, and therefore sustained higher demand for the supporting infrastructure: not just generation capacity, but grids and essential electrical equipment. Even if the outturn is only 3x not 6x, the already stressed electrical supply chain is set to get even busier still.
The power equipment boom - irrational exuberance?
This is why we are seeing supply backlogs and price inflation across the electrical equipment space. While solar panels and batteries are getting cheaper thanks to severe oversupply, the opposite is true of other key segments like cables and transformers. As we shift inexorably towards an electrified energy system - albeit at different paces, depending on where you live - the essential components of that system are in ever higher demand. And it is not quick or easy to bring on new manufacturing capacity.
This is part of the reason why the big energy winners over the past year have been providers of critical power and grid equipment. In fact, the past six months has seen not just a turnaround but an outright boom for many clean energy stocks, as reflected in this chart comparing the performance of the S&P Global Clean Energy Index (dark blue line) to the S&P 500 (light blue line) and gold (yellow line). The very strong recovery over the past 6 months follows years of severe underperformance by listed clean energy companies over 2022-24.
Solar generation output vs other sources, IEA historical data and projections 2010-50. Source: Carbon Brief.

Global electricity supply vs demand 1H25 vs 1H24. Source: Ember

Historical average battery pack costs and storage additions. Source: Ember
The Dawn of the Clean Firm Electricity Age
IEA projections are hardly noted for their irrational exuberance. In fact, they are regularly ridiculed for having repeatedly missed solar’s explosive growth of the past decade. Now, however, they show solar becoming the world’s single largest electricity source by 2033. If that still sounds like a while away, consider what a enormous head start coal and gas have had. A decade ago, coal’s share of global electricity generation was just under 40% and gas was 23%, with solar on 1%. Fast forward to now, and solar output is overtaking nuclear (~9%) this year, wind next year, hydro (14%) the year after, and will catch the two fossil giants early in the next decade.
In absolute terms, solar output is forecast to quadruple in only 5 years to 2030, as capacity reaches 3TW by the end of this year and keeps going thanks to persistent manufacturing oversupply. The impacts will be far-reaching. It has already started to upend Pakistan’s power system, offering a cheaper, more secure alternative for consumers previously stuck on an expensive, unreliable grid. Other countries will inevitably follow with their own versions of this template. Rising solar capacity also unlocks the logic of complimentary battery investment, to provide firmer power across more hours of the day. That, along with falling costs, is why we are now seeing very rapid battery capacity additions too.
A critical tipping point
These dynamics have brought us to a long-anticipated moment: when incremental clean electricity capacity, at a global scale, outpaces the growth in electricity demand. As the chart from Ember below shows, this is the point where fossil fuels start being squeezed out of the global power system.
Note that this occurred in the first half of this year despite a fall in hydropower output, which we could normally expect to fluctuate around the same level over time. Absent that, the fall in fossil generation would have been more than double what it was. But although China is set to build the world’s largest hydropower project in Tibet over the next few years, this story is not ultimately about hydro. It’s about the rapid expansion of renewables that can be manufactured to harvest effectively limitless free resources (sun and wind), backed by explosive growth in batteries to store their output, just as the invention of refrigeration changed the food industry.
It could be that we are entering a plateau phase where new clean output roughly keeps pace with incremental demand. But all the evidence points to much higher solar and wind output, so it seems inevitable that this will outpace demand. That in turn will depress the returns on existing fossil generation plants, and certainly any planned new ones.
Of course, the big driver of change is China, which is powering forward in electrification and renewable output, while the US administration seems more focused on putting up new barriers to clean energy. It is all too tempting to contrast the two directions of travel - as per these headlines published on the very same day last week:


Contrasting headlines on China and US solar projects, both published 10 October 2025. Sources: New York Times, Electrek
Petrostate vs Electrostate
The story virtually writes itself. A tale of two energy superpowers: the Petrostate versus the Electrostate, with all the geopolitical implications that are outside the scope of this piece. There is no doubt that the US’ energy transition will now be slower than it would otherwise have been without the switch from Inflation Reduction Act to One Big Beautiful Bill (or the Inflation Induction Act, as it has been aptly dubbed).
Meanwhile, China’s energy transformation, built on technology, manufacturing and control of supply chains, has burst its domestic dam and is flooding out in all directions around the world via exports of ever cheaper energy infrastructure, both on the supply side (solar panels, batteries) and demand side (EVs).
China is not only the world’s electrification leader - it is accelerating further ahead versus the US and Europe. In China, EVs reached more than half of all new vehicle sales in June, just 4 short years after internal combusion engine (ICE) totally dominated. And where China leads, the world is following, based on compelling economic self-interest. As Chinese supply expands and costs fall, the same crossover will inevitably ensue in many markets. We are already seeing this in markets as diverse as Ethiopia and Nepal.

Crossover of new energy vehicle (NEV) sales vs others in China, 2021-25. Source: Reuters
It is no coincidence that at the same time we are also seeing Chinese emissions plateauing - another critical tipping point. After this plateau, it’s simply a question of the speed of systemic change. That speed may well surprise those who still claim the transition is slowing down. EVs are increasingly eroding fuel demand across the world - reducing oil demand by 1.3 million barrels per day last year and forecast for 1.8 mbd this year. That number can only increase. China has been easily leading driver of incremental oil demand and emissions in the first quarter of this century, but it’s per capita road transport oil demand is topping out at a fraction of the US.
The past can be a useful guide to the future, not so much literally but across technologies and geographies. Historical EV sales data may not tell us that much about future EV sales. But looking at how old brick phones gave way to Nokias and then today’s ubiquitous smartphones might tell us a bit more. As they became affordable, available and life-changing equipment, consumer uptake rocketed and old models quickly became obsolete. A similar dynamic looks likely for cars.
Electrostate Convergence
The regular stories of US renewables projects hitting the buffers perhaps obscures a more nuanced reality. Policy u-turns and the whims of powerful narcissists should not distract us from what is actually getting built on the ground. Even in a country whose government is actively blocking renewable projects, it is solar that is on track to deliver well over half of new generation capacity this year.
That may partly reflect a rush to get projects over the line before rule changes kick in. But even so, the proud Petrostate and world-leading natural gas exporter is still expanding its own grid overwhelmingly with clean energy, as this chart of 2025 capacity additions from the US’s own Energy Information Administration (EIA) demonstrates.

US electricity generation capacity additions, actual 1H25, forecast 2H25. Source US EIA.
And when you zoom out to observe the past quarter century of US electricity capacity additions, from the same source (US EIA), the trend is overwhelmingly clear. The colour shifts decisively from brown to blue, no matter who is in charge. If anything, this makes an even more compelling case that the future of the US grid, like others, will be clean power. In a world of maxed out gas turbine supply chains, new solar and (especially onshore) wind are usually the simply the best or only routes to get new capacity up and running quickly. The cost and lead time for new nuclear plants, whether large or modular, makes them unable to compete.

US electricity generation capacity additions, 2000-25. Source US EIA.
There is no turning back. Economics and simple pragmatism trump reactionary ideology. Speed to power has become essential.
The reality is that renewables are prevailing even in Trump’s US, implying that even the world’s great petrostate will also end up as an electrostate, even on a different schedule. That is a very strong indicator of the prospects for clean energy technologies just about everywhere else, as adoption curves in Africa and Asia are already proving.
Make no mistake: the transformation of energy is definitely speeding up…