

ENERGIZED: Investment Insights on Energy Transformation
Edition 11
The Great Rebalancing: The Next Wave of Renewable Globalisation
20 August 2025
Disclosure: an investment in Scatec ASA is part of the Energized portfolio.
Please note: This newsletter is for general informational purposes only and should not be construed as financial, legal or tax advice nor as an invitation or inducement to engage in any specific investment activity, nor to address the specific personal requirements of any readers. (Full disclaimer below).
Key Takeaways:
Renewables will surpass coal as the world’s top electricity source by next year, driven primarily by rapid solar expansion. As incremental renewable supply catches up with fast-rising electricity demand, the era of fossil generation displacement will soon begin.
However, renewables’ rollout still remains very uneven, with many countries left behind due to lack of finance. Africa has vast clean energy potential but relatively limited investment to date. Cost of capital is the limiting factor: it can be more than double than in more developed countries.
However, this imbalance will start to unwind as clean power goes truly global. Not just due to renewables’ cost and speed to market advantages, but because such emerging countries have compelling economic, strategic, social and environmental reasons to facilitate rapid expansion of their clean energy infrastructure.
The rationale becomes overwhelming when declining or exportable hydrocarbon resources contrast with vast untapped solar and/or wind potential. A notable example is Egypt, which is pivoting fast to renewable power, alongside other MENA countries.
Solar/battery co-location / hybridisation enables firmer generation output in such countries, further stimulating this next wave of global renewable rollout
Emerging markets focused clean energy developer Scatec ASA (Oslo: SCATC) is particularly well aligned with this theme. Doubling its operating capacity to >9 GW over the next 2-3 years will help to and accelerate growth, delivering 15-30% project equity returns, while sales of older projects strengthen its balance sheet.
Scatec has the financial and technical expertise to efficiently scale up renewable and hybrid projects across its priority markets of Brazil, Egypt, South Africa and the Philippines, where it enjoys early-mover advantages.
Renewables: encouraging progress so far, but so much more to come
Global electricity consumption rose 4.4% in 2024, twice as fast as total energy demand. Over 2025-26, it is expected to average 3.5% over 2025-26, much higher than the 2.6% of the previous decade. This acceleration is being driven by:
· Electrification: notably of transport and industry, whereby electricity represents a larger share of final energy demand
· Rising global living standards: reflected in increasing demand for air conditioning
· Digitalisation: reflected e.g. in the growth of data centres, especially in the US
A key change is how this incremental demand is being met. According to IRENA, in 2024, renewables accounted for 93% of new electricity capacity and 74% of new consumption, as solar and wind generation surpassed 4,000 TWh (vs total demand of ~30,000 TWh). That figure will exceed 5,000 TWh this year and 6,000 in TWh in 2026.
In other words, we are fast approaching the tipping point where incremental renewable supply overtakes incremental electricity demand, signalling the long-awaited plateau and eventual fall in power sector emissions.
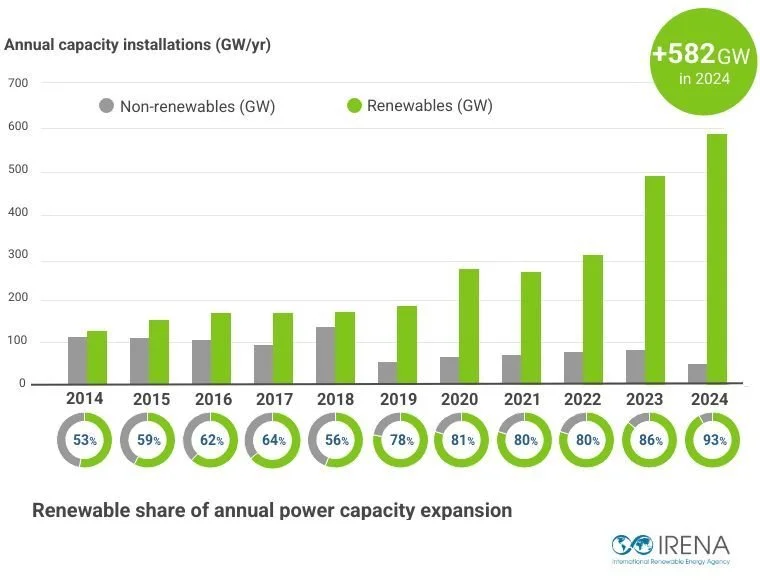
Renewable capacity installation growth 2014-24. Source: IRENA
That’s encouraging, but it’s not the whole story. This renewable growth remains very unevenly distributed, largely in China, the US and Western Europe, leading to wide mismatches between regions. Clean energy has still barely begun to reach its full global potential.
The reason is financial, of course. High perceived risks has curtailed clean energy investment into many so-called emerging market and developing economies (“EMDEs”). Africa still only accounted for a mere 3% of global clean energy spending in 2024, despite being nearly 20% of the world’s population. A recent IEA study shows that the cost of capital for clean energy projects in certain EMDEs can be double than in advanced economies.
But we see this imbalanced starting to self-correct in the next phase of energy transformation. Perhaps dramatically so.
The reason is again financial. Increasingly, higher risk-adjusted returns will be found in many of these previously overlooked “frontier” jurisdictions that offer an attractive combination of power market arbitrage, bankable legal frameworks and exciting growth prospects.
This shouldn’t be surprising. Asia and Africa are expected to account for practically all net future energy demand growth thanks to their still rising populations and developing economies. Moreover, this will be increasingly in the form of electricity, thanks to electrification and digitalisation. Add in the fact that clean energy costs continue to decline, and that many such countries have large under-exploited natural solar and wind endowments, then explosive renewables growth in those countries begins to look inevitable. And that is what is starting to happen.
Of course, there are also overwhelming social and climate rationales to channel more clean energy finance into such countries: to improve living standards, prevent premature deaths from cooking with dirty fuels, and decarbonise grids. But that has been true all along and hasn’t yet moved the dial. Well-intended targets set at COP conferences like the tripling of renewables by 2030 are essentially arbitrary top-down approaches. But the real solution is emerging more organically: the valuable arbitrage opened up by ever cheaper renewables in many high-priced fossil-dependent power markets across the “Global South”. The superior risk-adjusted returns on offer is a compelling draw for investors and developers with the patience and expertise to navigate these markets. Where these investments prove robust, this creates a self-fulfilling logic that can be far more impactful in building clean energy momentum.
Why clean power is finally about to go truly global
While the growth of renewable power in Europe, the US and China is well documented, other countries from south-eastern Europe to north, central and southern Africa and south and south-east Asia still have dirtier grids. Being still much more dependent on coal, gas and biomass, or even burning oil for power, also typically means high power prices.
These regions are largely in the world’s “solar belt.” For example, the Global Solar Council notes that 60% of the world’s land best suited to solar development is in Africa. But by 2024, solar still provided only 4% of Africa’s electricity. Falling solar PV and battery costs are expanding the opportunity for rapid capacity expansion to undercut high-priced power markets across this solar belt.
For governments, the challenge is to provide a demonstrably bankable legal framework, to really open the gates to renewable project investment. The incentives are clear:
Economic: new renewable capacity is increasingly cheaper than new fossil capacity, so more renewables can help to pull down power prices over time. PV module costs were down 66% over 2022-24 alone and battery storage down 89% over 2010-23, while manufacturing oversupply suggests further falls to come. They can also be installed quicker, reducing the impact of higher financing costs.
Social: lower power costs reduce the financial burden on sections of society who struggle to afford expensive power; this is especially relevant where the government may be subsidising the difference
Energy security: once installed, renewable infrastructure produces secure domestic energy for decades, mitigating import needs and saving other valuable resources
Environmental: reduced pollution and emissions contribute to public wellbeing and decarbonisation goals.
In short, for countries with abundant but under-exploited solar or wind resources, new renewable capacity now offers an irresistible combination of lower costs, improved energy security and cleaner grids. This triple win unlocks a world of investment opportunity.
Risk mitigation
Sounds like a no-brainer, but what about all those frontier market risks? How do investors really know they’ll get their money back, let alone make a return, operating in less proven jurisdictions? In practice, these risks are mitigated or passed on in several ways. As with any investment, it’s not about avoiding risk altogether so much as understanding what risks you are taking and how to effectively reduce them to ensure a reasonable return.
Examples include:
Political risks: a well-established political risk insurance market can protect foreign direct investors against catastrophic political outcomes (regime change, expropriations, legal/regulatory changes, etc), providing compensation in such relatively rare events. As jurisdictions become more proven, the cost of that insurance declines.
Financing risks: participation by multilateral financial institutions (World Bank, IFC, EBRD, African Development Bank, etc) and government-backed export credit agencies can substantially reduce the overall capital burden for many projects. Project finance structures with commercial banks can typically be overlaid, before the developer or sponsor consortium then invests the remaining equity - usually a relatively small part of the total capital. This will be structured without recourse to the sponsor(s) in the event of default.
Foreign exchange and interest rate risks: these can and will often be hedged at the time of project final investment decision, so that exposure is limited and known up front.
Market, offtake and contractual risks: investors will typically sign Power Purchase Agreements (PPAs) giving long-term (up to 25-year) price certainty, often with inflation protection. These may be either with state-owned entities or major local companies with strong parent companies and solid credit ratings. PPAs may benefit from sovereign guarantees, effectively making it government payment risk, similar to a government bond.
Naturally, early movers into more frontier markets can benefit from establishing key relationships, better understanding of local laws and practices, awareness of emerging project opportunities and in-country economies of scale. With such expertise, it is then about structuring efficient financing packages, delivering efficient construction and providing reliable operations, all of which benefit from experience curves. This can translate into higher returns than in more saturated or developed markets.

Egypt’s power generation mix, 1985-2024. Source: Our World in Data
Case study, part 1: Egypt’s energy trap
Let’s take a relevant example: the energy predicament of Egypt. In 1995, 3 decades ago, this analyst first briefly lived in Egypt. Back then, the population was 67 million, roughly similar to the UK today. Cairo was a frenetic, chaotic city, bursting with larger-than-life characters and incessant car horns, where the trappings of modernity overlaid ancient structures. In a land that is over 90% desert, a rampantly growing population was almost entirely wedged into the Nile valley and delta. The constant zahma, overcrowdedness, felt unsustainable.
In those days, Egypt’s domestic gas resources in the Nile Delta and southern Mediterranean could meet its own needs. The plan was actually to export surplus gas, at first by pipeline to neighbouring Jordan, and ultimately to the world market as LNG. The latter was first achieved in 2004, providing valuable government revenues.
Fast forward to today and Egypt’s population is 117 million, of which around 20 million live below the lower-middle income poverty line – i.e. less than $3.65/day. The country has become embroiled in an energy trap that has become a critical national strategic weakness.
As the population rose dramatically, so did gas demand. Around 80% of Egypt’s electricity is gas-generated. However, as gas resources dwindle and international prices remain structurally higher since the invasion of Ukraine, sustaining local gas production has become an accelerating financial treadmill. Higher domestic gas demand eventually overtook supply, turning surplus into deficit. The lack of export revenues in turn limited the capital available to reinvest in maintaining production.
By 2019, Egypt was forced to import gas from Israel via a pipeline first built to flow in the other direction. This leaves it also vulnerable to regional upheaval: the recent Israel-Iran war temporarily shut in Israel’s offshore fields and gas exports. As rising gas import bills replaced export revenues, it also fell behind on paying international companies operating its own gas fields, preventing necessary investment. The result was a vicious circle of accelerated gas production decline, leading to lower revenues and investment, leading to higher import dependency and less cash to reinvest. From 2021 to 2025, Egypt’s gas production fell by as much as 40%, as its flagship offshore gas field, Zohr, only discovered in 2015, went into rapid decline, partly due to faltering payments and investments. This has deepened the state burden of entrenched energy price subsidies - another systemic trap, since their removal is a social and political red line.
Switching to become an LNG importer required investment in new floating regasification capacity, but it also left Egypt at the mercy of international gas markets just when it could least afford it. The timing was disastrous, as Egypt became highly exposed to the gas-driven 2021-23 global energy crisis and ensuing structurally higher prices. This resulted in a series of blackouts and desperate appeals for reduced power consumpion, in a country where searing summer heat requires air-conditioning to make life bearable. The expected fall in LNG prices over coming years may yet buy some time, but the real issue is plummeting domestic supply.
In such a predicament, reversing Egypt’s gas production decline for any meaningful period looks very challenging. Existing fields will decline further by the time any new discoveries come online. More LNG and pipeline imports from Israel are the only other games in the gas town. But deepening that dependence just looks like sinking further into the trap.
Is there any other solution?
There is no immediate magic bullet. But what if all that 90% desert land offers a cost-competitive, inexhaustible and highly-scalable alternative to gas? It’s hard to think of many countries better suited to large solar projects (and deserts can be pretty windy too). In fact, the Global Solar Atlas ranks Egypt at number 4 on the list of top solar PV potential countries, after only Namibia, Chile and Jordan, with 2,000-3,200 kWh/sqm annual solar irradiance and over 3,500 hours of sunshine per year. Plus, solar’s daily variability is increasingly being solved by co-locating batteries to produce firmer generation. This hybridisation opens up a whole new phase in renewable development.
A few solar and wind farms fixing Egypt’s big gas conundrum may sound like wishful thinking. But over the longer run, one-off combustion of expensive and volatile gas imports will be no match for repeatable, reliable power from multi-GW scale farms stretching across the country’s vast deserts. That is why a sharp pivot from gas to renewable power looks existentially imperative.
In fact, Egypt’s grid overhaul is already underway and the steep part of the S-curve is arriving. Its projected renewable growth is a perfect example of what we mean by energy transformation. It aims to more than triple its renewable and battery capacity to 25 GW by 2030 and clean output ramping up from 13% of the total in 2023 up to 60%. Whether or not such ambitious targets are hit, it demonstrates how serious and urgent this is for Egypt’s government. This initial surge would then pave the way for solar, wind and batteries to increasingly dominate the grid through the 2030s, ultimately with only residual gas dependence for peak load periods.
The shifting national energy security paradigm
Egypt’s impending power sector transformation is also indicative of a wider global realignment. Similar shifts are likely in other fossil and biomass reliant EMDE countries, driven by the same logic. Renewable infrastructure will increasingly win out over unreliable geology and import dependence.
Egypt’s case also seems especially relevant across the rest of Africa, where the gap between clean energy potential and reality remains the widest, with only a small fraction of global clean energy investment. This is simultaneously a major problem and a huge opportunity. Around 600 million Africans still lack reliable access to electricity, leading to millions of premature deaths. Of the world’s 363 GWh of battery capacity in 2024, less than 1% was located in Africa. There is huge untapped potential for clean energy investment across the continent, with all the wider benefits that can bring in leapfrogging the dirty industrial development path of western nations.

Energy investment by region, 2015 vs 2025. Source: IEA
Investing in EMDE clean energy growth
So it’s clear: many EMDE countries, like Egypt, can benefit enormously from attracting urgently needed clean energy infrastructure growth. That doesn’t mean that oil and gas will disappear overnight from their energy mix. The rebalancing will accelerate, but it will still take some time.
But who specifically do the EMDE countries need to attract? Which companies are addressing this generational opportunity to bring cheaper, cleaner power to nations where it can have such a positive impact?
There are plenty of renewable developers out there. But the list of publicly quoted operators focused particularly on the emerging markets opportunity is much shorter, especially since Brookfield took Neoen private last year.
But one company stands out: Norway’s Scatec ASA (Oslo: SCATC).
Scatec describes itself as: “a leading renewable energy solutions provider, accelerating access to reliable and affordable clean energy in emerging markets. As a long-term player, we develop, build, own, and operate renewable energy plants, with 6.2 GW in operation and under construction across five continents today.”
Its 4.2 GW of operating capacity is concentrated mainly in the solar belt across Africa, South-East Asia and South America. Its four highest priority markets are: Brazil, the Philippines, South Africa and, you guessed it, Egypt. The latter two countries jointly accounted for 75% of all new clean energy projects in Africa last year. In Egypt’s case, helping to displace gas; in South Africa’s case, coal.
Rather than spreading themselves too thinly, there is clear strategic logic for Scatec to focus on a handful of uncorrelated core markets where it can enjoy both competitive advantage and diversification. But why these countries specifically? Firstly, they have an existing presence, with local expertise already established, projects underway or executed and key relationships built. Other key factors include:
Rising power demand offering an attractive growth outlook
Stable regulatory environment
Established offtake routes
Potential to deliver the required returns
Scatec is targeting self-funded growth across these core markets focused mainly on solar PV and battery energy storage system (BESS) opportunities, along with some wind, hydro and possibly green hydrogen too. Its NOK 4bn programme of divestments of non-core operating assets will mainly help to pay down debt and reduce corporate leverage, but it will also support this growth. There is always a risk that divestments do not materialise or cannot achieve the right prices, but so far this programme seems on track. In Q1 2025, sale of a 130 MW Ugandan hydro project to TotalEnergies helped reduce corporate net debt from NOK 7 BN (~£1bn equivalent) to NOK 5.2bn. Project level net debt fell from NOK 14.9bn to NOK 13.4bn in the same period. Most of Scatec’s corporate debt falls due in 2027-28, so there are limited near-term refinancing needs.
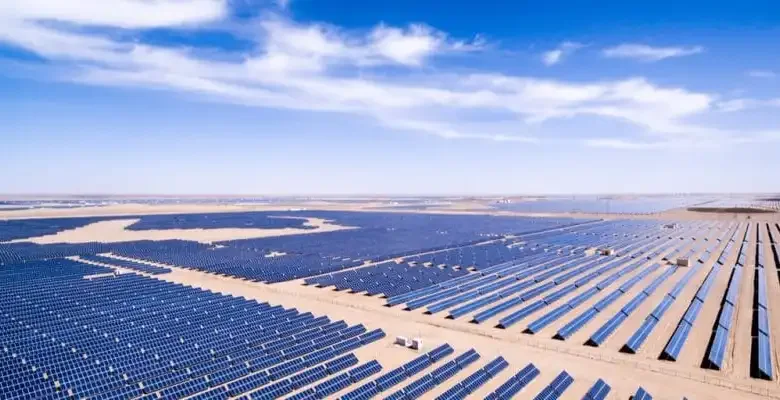
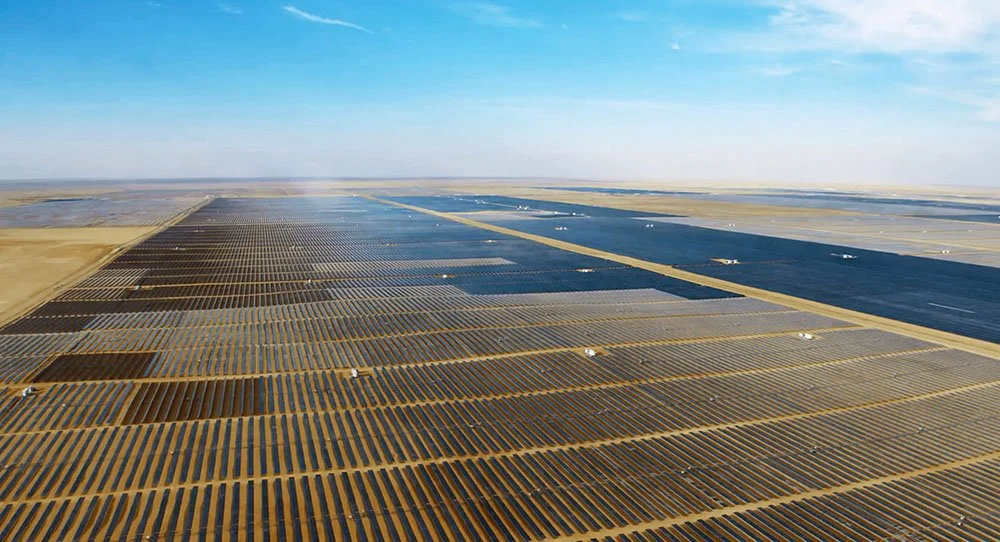
Benban solar farm in Upper Egypt, of which Scatec has developed 380 MW. Source: Draya
Scatec share price 1 January - 1 August 2025. Source: Euronext
But since the focus of Energized is investing for long term value, let’s zoom out much further and look at the 5-year view, which tells a very different story.

Scatec share price last 5 years to 1 August 2025. Source: Euronext
Here we see the classic boom followed by prolonged and painful bust. After a wild run-up over 2020, Scatec peaked at the heady heights of NOK 400 in early 2021 before a precipitous decline to a nadir below NOK 60 by late 2023. Since then it has chugged along much more steadily until a recent uptick towards the NOK 100 mark – still only a quarter of that all-time high.
The first thing that comes to mind when looking at this chart is the dotcom bubble, when investors went mad for internet stocks back in the early days of the world wide web (which could have some parallels with AI stocks today too, of course), sending the valuation of listed e-commerce start-ups stratospheric, before they all crashed as the bubble burst. Ultimately, of course, some internet-based companies really did fly – it just took them longer. In clean energy, a similar bubble occurred in 2020-21, with valuations peaking on early promise. But then interest rates rose to combat post-Covid inflation and it all unravelled over 2022-24.
Scatec has had its tough times through that share price boom and bust, but the future now looks more promising again. Compared to 5 years ago, it has a more robust growth story backed by solid fundamentals: renewables are fundamentally more competitive and the emerging market demand is materialising. Having bottomed out in October 2023, Scatec’s valuation has since been rebuilding at a more sustainable pace as it looks increasingly well placed to capitalise on the global renewable rollout.
Scatec’s relative lack of direct listed competition may also be a source of long-term value. Of course, it does have various competitors, including private equity funds and powerful state-backed players like Masdar. The absence of many listed peers offering investors direct, focused exposure to this theme may attract more institutional investors over time. There may be more competition from bigger listed developers moving from developed to less developed markets, or Chinese equipment manufacturers moving into the developed space to capture more value from their products, but either way Scatec looks well placed to retain a leading position in its core markets, all of which continue significant running room for growth.
Case study part 2: Egypt
On that note, to round off our Egypt case study, as one of its core markets, Scatec now has 5 projects there, one operational, two in construction and two in development, adding up to a lot of capacity growth:
Operational: 380 MW at the 1.8 GW Benban solar plant, also under a 25-year Feed-in-Tariff with Egyptian Electricity Transmission Company (EETC). Benban covers an area of 36km² and uses bifacial panels to maximise output.
Construction: 1.1 GW solar + 100 MW / 200 MWh BESS Obelisk project, backed by a 25-year $-denominated PPA with EETC, signed in June 2025. When completed, this will be the company’s first large-scale hybrid (solar + battery) project. Phase 1 is due to reach COD as early as the first half of 2026, with the Phase 2 in the second half (timelines that oil and gas, hydro or nuclear projects could only dream of). 80% of the capital costs are being financed by a syndicate of multilateral lenders including EBRD, AfDB and BII.
Construction: 900 MW Ras Shukeir wind project, also backed by a 25-year $-denominated PPA with EETC (yes, them again), also signed in June 2025.
Development: 25-year corporate PPA signed for 1.1 GW Solar PV + 100 MW / 200MWh BESS with Egypt Aluminium (the country’s largest aluminium producer), backed by a sovereign guarantee.
Development: 100 MW Ain Sokhna green hydrogen project, to be powered by 260 MW solar and wind capacity. 20-year offtake term sheet signed with Fertiglobe to produce green H2 for green ammonia.
Conclusion: Aligning with unstoppable global clean energy growth
In 2015, wind and solar accounted for only 4% of total global electricity generation. This year, that number is expected to be 17% - and it’s continuing to rise fast. We are heading ultimately for a world where these sources will account for 60-70% of total consumption – perhaps even more – in most countries, supported by a range of supply and demand side flexibility solutions, and at lower total system cost than gas and coal-based systems.
From this point, those left out of the rapid renewable growth to date have every reason to try to catch up. Scatec has the right market presence, financial expertise and technical capabilities to help deliver this next phase of the global clean energy rollout.
Important Disclaimer: This newsletter is for general informational purposes only and should not be construed as financial, legal or tax advice nor as an invitation or inducement to engage in any specific investment activity, nor to address the specific personal requirements of any readers. Any investments referred to in this newsletter may not be suitable for all investors. In reading this newsletter you acknowledge that it is your responsibility to ensure that you fully understand those investments and to seek your own independent professional advice as to the suitability of any such investment and all the risks involved before you enter into any transaction. Strome Partners accepts no liability for any loss or adverse consequences arising directly or indirectly from reading or listening to the materials herein and on our website and make no representation regarding accuracy or completeness. We accept no responsibility for the content or use of any linked websites and third-party resources. Future events are inherently uncertain and there can be no certainty that any assessments, projections, opinions or forward-looking statements provided or referred to herein will prove to be accurate.
A scalable project machine
Those asset sales help to lay the foundation for sustainable self-funded growth, via a standard, highly repeatable three-stage project model:
Development: Initial securing of land, grid connection rights and offtake agreements – typically the highest return stage, establishing the basis of a profitable project before any major expenditure. Construction funding can be raised by farm-down (part-sale) of projects at this stage to other equity partners or investors.
Construction: As a project developer (not just manager), Scatec typically undertakes its own physical installation – the Engineering, Procurement and Construction (EPC) work – rather than outsourcing to other contractors. This retains margins in-house and can also be more efficient given less reliance on third parties. This stage creates the next tranche of value, between final investment decision (FID) and commercial operating date (COD) – or from a desktop model to reality. A key advantage of solar is its relatively fast and less technically risky installation, essentially rolling out standardised, modular, stationary equipment.
Operation: Operating the asset is the third and least-value adding stage. Value can be realised either by efficient management generating predictable cash flows, refinancing project construction debt on better terms, or a partial (farm-down) or full exit – ideally at a premium to book value – to monetise and recycle capital. Scatec has achieved 6 such exits over the past 2 years and plans further divestments in non-core markets to help self-fund new projects.
Payment predictability and attractive returns
A key risk mitigant is that ~80% of Scatec’s current revenues are under long-term Power Purchase Agreements (PPAs), with an average duration of 14 years. Project debt largely matches revenue currencies and is also 85% hedged, reducing foreign exchange and interest rate risks respectively.
Scatec expects to more than double its 4.2 GW operational portfolio to over 9 GW by completing a further 2.0 GW under construction and its 3.2 GW pipeline. This rollout is relatively quick: all seven construction projects are all expected online in the next 12-18 months, while pipeline projects can be expected in the next 2-4 years.
That 5.2 GW consists of solar or hybrid solar/BESS projects in its core markets with pre-agreed PPAs averaging 20 years. This predictability makes them very capital efficient, with third-party finance, loans and grants providing up to 80% of the estimated $2.8 billion total capital costs. Less than 10% is projected to come from Scatec’s own equity investment, which can also often be structured as the last money into a project.
That translates into equity returns (IRR) in the 15-30% range, before further potential upside from subsequent refinancings, farm-downs or divestments. Importantly, the visibility of these returns is fairly strong from the outset, given construction risks are well understood and able to be contractually mitigated up-front.
Key metrics
Over the past three years, revenues have risen from NOK 3bn (2022) to NOK 4.4bn (2024). Over that time, earnings flipped from a NOK 1.3bn loss to a NOK 1.3bn profit, or from NOK -4.53 to NOK 2.73 per share. For 2025, EPS are projected to rise substantially into the NOK 6-7 range.
Corporate net debt has stabilised over those 3 years in the NOK 20-23bn range, as the effects of organic growth and asset rotation start to flow through.
Based on a share price fluctuating around NOK 100, 2024 earnings of NOK 2.74 reflect an expensive price to earnings ratio of 36.5x. However, projected 2025 EPS of NOK 6 implies a forward P/E of 16.7x, which would be significantly better value.
In its Q2 2025 results released on 19 August 2025, Scatec reported a 51% increase in proportionate revenues and a 19% increase in EBITDA for the quarter, implying that the business strategy and execution remains steadily on track.
Share price performance
At the time of writing Scatec’s market value is just over NOK 16bn, or around GBP 1.2bn. At this mid-cap size, some share price volatility is always possible. For now, it remains a growth rather than income story – it has not paid a dividend since 2022.
Lately, the shares have already performed very strongly amid the market recovery from early 2025 turbulence. Starting the year at around NOK 80, it went sideways in Q1, reaching a low of 70 NOK by early April. Since then, like many others, it has rebounded strongly, reaching the NOK 100-105 range over the past month. The growth story described above is getting increasingly priced in.
