


ENERGIZED: Investment Insights on Energy Transformation
Edition 14
The clean energy equity train has left the station
14 November 2025
Please note: This newsletter is for general informational purposes only and should not be construed as financial, legal or tax advice nor as an invitation or inducement to engage in any specific investment activity, nor to address the specific personal requirements of any readers. (Full disclaimer below).
Key Takeaways:
Clean energy equity indices have surged over 50% since early April, clearly outpacing the wider market rally. This looks like the first wave of a deeper current, not the false dawn of 2020-21, as the technologies are now far more competitive than even 5 years ago.
Such strong recent momentum certainly increases vulnerability to a much-forecasted market correction. But this shouldn’t distract from the deeper clean energy investment opportunity, driven by rising living standards and electrification. Any correction might offer useful long-term entry points for electrification, renewable and flexibility focused investments.
The next decade sees a scale-up phase for clean energy technologies thanks to cost and speed to market advantages. Battery growth remains rapid, while solar installations decelerate off a higher baseline. Markets diversify away from Chinese domination towards emerging demand across Asia, Middle East, Africa and Latin America.
This brings steady tailwinds for renewable developers, specialist equipment manufacturers and gridtech operators. Conversely, solar and battery suppliers face persistent overcapacity issues.
AI’s power demand growth tightens US power markets, but AI also drives efficiencies that curtail excessive demand growth while inducing wider adoption (rebound effect), resulting in steadily higher AI-related energy consumption.
Clean energy equities are fighting back
This year looks ever more like a pivotal one in the energy world. One way to understand the radical change underway is to follow the money. In terms of capital investment, the ratio of clean to fossil energy expenditure ratio has shifted from 0.8x to 2.0x over the past decade. $2.2 trillion is now being invested annually in clean energy technologies and supporting infrastructure, versus $1.1 trillion in fossil fuels. That gap will widen further, to deliver the new generation, storage and transmission required to meet fast rising electricity demand. From 152 GW in 2015, by this year annual renewable capacity additions have quintupled to well over 750 GW.
Energy equity markets, meanwhile, reflect investors’ views on whether these big investments will make sustainable returns. Following dismal underperformance since 2021, we have seen a dramatic recovery in clean energy equities this year – clearly outpacing the wider market rally. Developers and operators of renewable infrastructure, transmission equipment and associated software have been firmly back in favour.
Since the early April low, the S&P Global Clean Energy Transition (SPGTCLEN) and European Renewable Energy Total Return Index (ERIX) have both risen by well over 50%, vs a mere 36% for the S&P 500. Here is a comparison of the last 6 months:
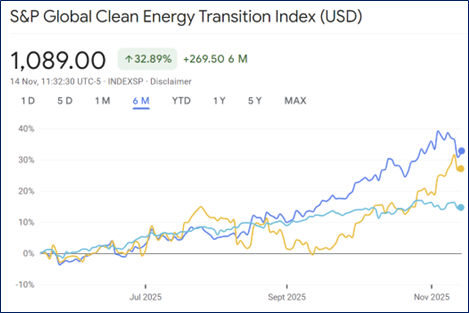
S&P Global Clean Energy Index (dark blue) vs European Renewable Energy Index (ERIX, yellow), vs S&P500 (light blue), last 6 months to Friday 14 November. Source: Google
But zooming out much further to the last 5 years shows a very different picture. Although clean energy indices have already regained much lost ground in the last 6 months, they are still far from their former highs, not to mention the still vast gulf in performance against the wider market. While the S&P 500 has risen nearly 90%, SPGTCLEN remains over 20% down over that period, with the ERIX even worse off.
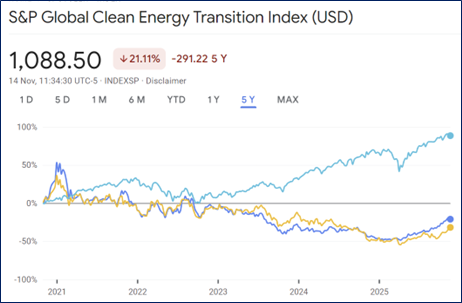
S&P Global Clean Energy Index (dark blue) vs European Renewable Energy Index (ERIX, yellow), vs S&P500 (light blue), last 5 years to Friday 14 November. Source: Google
In fact, SPTGCLEN is still at barely half of its early 2021 peak, although in fairness the latter was a bubble in clean energy stocks. Back then, excitement for renewable energies got ahead of itself, only to crash when inflation and interest rates rose. That was only five years ago, but back then the economic competitiveness of clean generation technologies was nowhere near where it is now - or where it will be by 2030. This time around, that cost advantage can drive genuine long-term momentum. And it’s not just cost, but convenience too - with solar and batteries now typically the quickest way to add new capacity.
Is this recovery sustainable?
So the big question for energy investors today is: will this strong recovery get swallowed up if the much-discussed AI bubble bursts, or is it just the first phase of an altogether bigger cycle?
To answer that, clearly we need to understand what’s driving the re-rating. The AI investment boom is no doubt playing a big part, as it drives the whole market higher, especially at its epicentre in the US, where it is widely perceived as an unstoppable juggernaut that will hoover up all new power supply. Forecasts such as that by Lawrence Berkeley National Laboratory expect it will drive half of US electricity demand increase to 2028 (and most likely beyond), increasing its share of the US power market from 4% to 8-12% in just three years.
This rapid growth in the US tends to dominate perceptions of data centre and electricity demand growth. But the broader picture looks different. Globally, data centres account for only 1.5% of electricity consumption, so even with very rapid growth the wider impact will remain relatively marginal. The path into the International Energy Agency (IEA)’s “Age of Electricity”, where electricity demand consistently far outpaces wider energy demand, is not being led by AI. Of the 6.5 TWh (22%) growth in annual electricity demand by 2030, data centres will account for only 8%, or at most 12%.
Over the next 5 years at least, the top electricity demand growth drivers worldwide are expected to be:
1. Industrial demand: particularly as low-to-medium temperature industry electrifies
2. Transport electrification: i.e. the switch to electric cars, bikes and trucks
3. Electric appliances e.g. in commercial and residential buildings
4. Air conditioning as living standards rise and the world adapts to a warmer climate
5. Data centres mainly driven by rising AI usage only come in fifth.

Sources of global electricity demand growth 2024-30. EIT = energy intensive industries. Source: IEA, World Energy Outlook, 12 November 2025
From start-up to scale-up phase
As we head into the second half of this decade, we are moving into a new phase of energy transformation. After years of rapid acceleration, solar installations have reached a high annual rate of ~600 GW. As BloombergNEF’s lead solar analyst Jenny Chase points out, that is a large number relative to the world’s total installed capacity of ~10 TW. Such rapid growth is never infinite – and a natural deceleration now looks inevitable.
From a solar perspective, think of it as the scale-up phase after the start-up phase, while batteries for now remain in the earlier, steeper section of their adoption curve. Now that they are fundamentally more competitive, the next half-decade sees both technologies scale up globally. As Benchmark Mineral Intelligence notes: “falling BESS [battery energy storage system] cell price has caused system prices to more than halve in the last two years” alone. This is set to be a truly game-changing shift: BESS demand is already up another 36% so far this year (data up to September).
For solar, there will now be two distinct dynamics. First, Chinese installations are slowing sharply as that market starts to mature and regulatory changes are introduced. As China is over half of the global solar market, this has an outsized impact. But in parallel, the second dynamic is huge demand being unlocked across other emerging solar markets – particularly across the world’s “sunbelt”, including south and south-east Asia, the Middle East, Africa and Latin America. Africa still has over 700 million people with no proper electricity access at all.
Plus, of course, there is also the question of what replaces the natural retirement of older generation capacity both in mature and emerging economies. In fact, 2025 may well prove to be the tipping point where new clean generation capacity is meeting all incremental power demand, as the final green bar in this chart shows:

Clean power installations catch up with incremental demand, Q1-3 2025, Source: Ember
Over 2026-27, this second dynamic - the full globalisation of solar adoption - may not fully compensate for the China slowdown. If so, we’ll see a temporary peak in the global installation rate, but even so, that will still means more installations than any year prior to this one. For now, though, BloombergNEF forecast steady, slower growth in solar installations. It’s worth noting that similar forecasts by the IEA have turned out to be serious underestimates in previous years.
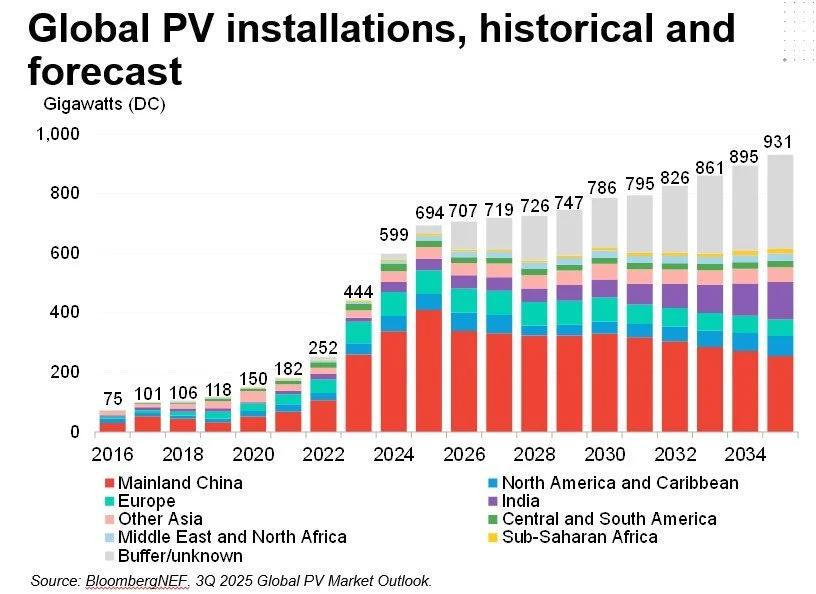
Historical and forecast annual global solar PV installations. Source: BNEF
The net result of this next phase of flatter installation growth should still result in installed capacity roughly doubling from ~3 TW to ~6 TW by 2030. In absolute terms, solar will remain the fastest growing energy source. Progress versus forecasts over the past decade also provides some useful perspective. The 554 GW of solar installed in 2024 is 15 times higher than the 2015 IEA forecast for that year. The point is not to get 10-year predictions completely right – that’s impossible – but to identify the direction of travel so we can get aligned with it.
Additionally, in the IEA’s stated policies or “STEPS” scenario – the closest thing they have to a most likely forecast in their newly released World Energy Outlook – as much as 80% of energy demand growth over the next decade is set to occur in high-irradiation “solar belt” countries. In that scenario, solar installations grow on average 14% over the next decade, even off the much higher baseline. That implies there is still a lot of unmet and latent demand to be met everywhere outside of China.

Final energy consumption growth, STEPS scenario. Source: IEA World Energy Outlook, 12 November 2025
It’s also worth noting that this continued solar growth outside of China is not just an emerging markets phenomenon. Even in Trump’s “petrostate” US, solar and batteries are set to dominate new capacity additions, of which around half is set to be driven by data centre demand.

Historical and projected US power capacity changes to 2027. Source: John Bistline / US EIA
This slower solar growth rate will probably get interpreted under the now-familiar “energy transition is slowing down” narrative. However, there is of course a crucial difference between slower growth and an actual deceleration. A more accurate interpretation would be the maturing of solar growth away from the steepest part of the adoption curve alongside diversification away from China as the solar revolution spreads out around the world.
Overall, as the next chart from Ember based on IEA modelling neatly shows, a very likely outcome is that global electricity capacity doubles from 10 TW to 20 TW over the next decade, overwhelmingly thanks to solar, followed by wind and some hydro, while gas and coal combined will remain relatively flat (nuclear grows too but off a much smaller base so is not really material to the overall picture).

Global electricity capacity evolution to 2035 under different IEA scenarios. Source Ember / IEA World Energy Outlook, 12 November 2025
So where will this market evolution take us? An immediate turnaround in fortunes for the oversupplied and largely loss-making Chinese solar industry seems unlikely, while battery manufacturers are under similar pressure. Those that survive, perhaps consolidating smaller weaker players along the way, have the prize of a rapidly expanding global market.
In this scale-up phase, the parallel revolution in battery storage will be a key catalyst for the next wave of solar growth. In more mature solar markets, battery flexibility ensures higher utilisation of solar capacity and improves its financial returns. In emerging solar markets, solar and batteries are now increasingly co-located from the outset. That in turn underpins the continued rapid growth in demand for batteries, as they get more efficient, cheaper and more critical for wider renewable growth.
This is how we get a mutually beneficial virtuous circle, where batteries unlock solar upside and vice versa. The solar and battery revolutions become self-reinforcing, setting the new template for how the world will largely be powered in the future. This comes mainly at the expense of coal and gas, depending on the market in question (each country has a natural inclination to maximise its own natural resource endowment, as China is doing across the whole energy spectrum).
Seeing beyond volatility
So, having understood these macro power dynamics, the question remains: are clean energy infrastructure and technology companies currently at risk from an AI-driven financial market bubble? Absolutely. Especially in the US, many have been swept upwards in the AI excitement. But the bigger question is: are they also exposed to a bigger supercycle in global electricity demand? Also absolutely. Both things can be simultaneously true. As the next decade to 2035 unfolds, electrification (of industry, transport and heating) and improving living standards create a rising tide for the clean energy infrastructure supply chain: from batteries and solar PV to grids and electrical hardware to EVs and electrified heating equipment.
The corollary, then, is to accept the fear of a crash, while continuing to invest steadily for the longer-term. Famous last words? Maybe. Popping of an AI bubble – assuming that is what it is – could well be painful, but for now, remaining invested specifically in the electrification supercycle - not frothy AI tech stocks - still feels like a rational choice, versus being paralysed by ubiquitous dire warnings and attempting to time the market around an unpredictable crash.
It’s also possible a crash may not arrive for much longer than many expect, or may disproportionately impact tech rather than energy companies. It may turn out that we are only in the very early stages of the AI revolution, evolving into new forms of intelligence, including humanoid robots, fully autonomous vehicles and the rest. No one really knows. And even if it does happen, it may ultimately prove a useful opportunity to get cheaper exposure to the companies that will thrive in the Age of Electricity. Either way, the second half of this decade will undoubtedly be volatile and noisy, as long-held assumptions in the energy world come under increasing challenge.
Positive feedback loops
Even with a bigger clean energy investment boom, there’s obviously no guarantee that those companies will outperform wider markets over the next decade. But we do seem to be rapidly approaching or probably already at some key tipping points that provide strong tailwinds for those companies. Examples include:
Solar and battery-firmed solar power becoming the default choice for new generation capacity in most of the world
Growth in renewable output exceeding electricity demand growth
EVs taking majority shares of new car sales in key markets, not least China
These tipping points are consistent with the expectation of broader, deeper, more diversified clean energy progress over the decade ahead. Falling costs will bring further such positive feedback loops, bringing a surge of renewable and battery installations across different markets, including those perceived as petrostates like the US, Saudi Arabia and the UAE.
This rising global wave of demand for solar, wind and battery hardware along with all the electrical infrastructure and equipment needed to hook it all up and into people’s lives, is the real context for the recent clean energy equity recovery. Without doubt, some of those supply chains remain in heavy oversupply today, leaving many manufacturers in unsustainable loss-making positions. But the winners of that Darwinian struggle have the potential to win very big indeed, while the installers and users of their products will continue to reap the benefits in the meantime.
Efficiency and Rebound Effects
One important note of caution is that previous electricity demand growth forecasts have often overshot. Especially when it comes to data centres, let’s not forget about energy efficiency. AI chip computing power is on a rapid efficiency curve: new models already use 99% less energy than in 2008. This extraordinary rate of improvement will undoubtedly continue, even at a slower pace as chip technology matures.
Jean-Pascal Tricoire, Chairman of Schneider Electric, claims that the energy efficiency unleashed by AI will ultimately outweigh its additional energy demand by up to 4-9 times, thanks to advances it will bring in predictive maintenance, smart charging, demand response, real-time analytics and autonomous operations. In other words, instead of devouring incremental supply, AI will be a grid enhancing technology (more on them soon). This is consistent with past technology booms, notably the internet’s emergence when efficiencies defused similar initial fears about excessive demand growth.
But even then, the rebound effect means greater efficiencies reduce barriers to adoption, increasing total demand. So even if AI ultimately ends up helping to save energy, this will likely be outweighed by the broader growth in demand for AI services, meaning the overall energy use driven by AI will still rise.