


ENERGIZED: Investment Insights on Energy Transformation
Edition 15
The Revenge of Sisyphus: 7 energy tipping points that change the world forever
1 January 2026
Please note: This newsletter is for general informational purposes only and should not be construed as financial, legal or tax advice nor as an invitation or inducement to engage in any specific investment activity, nor to address the specific personal requirements of any readers.
Key Takeaways:
As we enter the second half of the 2020s, 7 key tipping points make this the pivotal half-decade for the global energy system. These inflections reflect the high-water mark for the two largest historical energy sources, coal and oil, amid the inevitable rise of electrification.
By now:
(1) Clean energy infrastructure investment has reached double the fossil equivalent. This ratio will only increase further.
(2) Clean generation growth is matching global electricity demand growth - and will start to overtake it
(3) Battery-firmed solar has fast become the new template for electricity capacity
By 2030:
(4) EVs will reach half of global car sales
(5) Oil and (6) coal demand will peak
(7) As will energy emissions
Passing tipping points enables technologies to scale with the inherent force of gravity on a downslope: the snowball effect. These dynamics signal seismic shifts in energy economics, with big industrial and geopolitical and financial market implications.
This is stimulating an investment supercycle that equity markets started to reflect in 2025. After years of disillusionment, clean energy equity markets are rebounding.
This underpins the rationale for long-term capital allocation towards key electrification value themes, including: grid equipment, gridtech, flexibility, mobility, critical minerals, heating/cooling, efficiency and industrial reconfiguration.
Systems typically collapse faster than they grow. Oil and coal’s decline will accelerate through the 2030s. In 2026, equity markets will start to price this in. Current weakness in both oil and gas markets is the canary in the coal mine for traditional investment portfolios.
“I leave Sisyphus at the foot of the mountain! We always find our burden again. But Sisyphus teaches the higher fidelity that negates the gods and raises rocks. He too concludes that all is well. This universe henceforth without a master seems to him neither sterile nor futile. Each atom of that stone, each mineral flake of that night-filled mountain, in itself, forms a world. The struggle itself toward the heights is enough to fill a man's heart. We must imagine Sisyphus happy.”
Thus the French novelist-philosopher Albert Camus reframed The Myth of Sisyphus from its traditional interpretation of endless torment to one of perpetual purpose. Rolling rocks up mountains is actually what gives our lives real meaning.
He certainly wasn't talking about energy or tipping points. But this analogy also fits the imminent and decisive tipping points converging in the global energy system.
The end of another big year in energy in 2025 was a good time to stand back from the daily newsflow and evaluate the wider trends. Over recent decades, humanity has rolled the big, gnarly rock called clean supply up the steep mountain of energy demand. Early progress was slow and difficult. The task often appeared impossible - to many it still does. There were various false summits. But now, the gradient is finally tapering as we approach the true summit.
Beyond that point, something different happens: the force of gravity inverts from resistance to propulsion. The rock generates its own speed as it starts to roll down the other side. Momentum becomes self-fulfilling.

This is the moment we are now reaching in energy history. The second half of this decade to 2030 is the mountain summit: the pivotal phase. And just as that great rock tumbles down the mountainside with unerring force, it will change our world faster than many people realise. We stand at the threshold of a new economic order.
How do we know this? Because seven decisive tipping points have now either apparently arrived or will do in the next five years. They are:
Clean-to-fossil capex doubling (2025)
Clean power outpacing new demand (2025-26)
Hybrid power dominance (2025-26)
EV sales overtake ICE (estimate: 2030)
Peak oil (estimate: 2026-28)
Peak coal (estimate: 2027-29)
Peak emissions (estimate: 2028-2030)
These interrelated inflections take us from the overlapping ages of combustion of recent centuries (from biomass, wood and coal to oil and gas) towards a new Age of Conduction, where energy demand growth becomes effectively electric. It is a journey from commodities to technologies. From molecules to electrons. From extracting energy to farming it. From millennia of energy scarcity to, ultimately, a future of energy abundance. To be clear, we have not arrived there yet, but these are important milestones on the way.
This is nothing controversial: it is simply the latest revolution in human progress, from the agricultural and industrial revolutions to fossil-based consumer civilisation to today’s digital age. This next stage of the human journey is also closely linked to the dynamics of automated intelligence, which both consumes energy but also will enable us to harness and handle it much more efficiently. This complex interplay between energy and compute will play a central role.
Physically, it entails a generational infrastructure buildout, which in turn is catalysing a new investment supercycle. Most of this physical infrastructure does not yet exist, but its rollout is already inevitable. By 2030, global installed solar capacity will double to around 6 TW, while installed battery capacity quadruples. But the transformation goes far beyond just these.
Financial markets are signposts to the future. Last year saw a significant shift in equity markets, albeit somewhat obscured by the AI stampede. They started to appreciate the emergence of the new energy system - and to reflect the electrification investment supercycle it brings. Value started to accrue to the companies delivering this energy transformation: from generation developers to the grid supply chain and flexibility providers through to energy management and efficiency technologies.
This rebalancing process is underway, but it has not yet arrived in the share prices of major legacy energy listed players. Naturally, they are pulling every lever to keep shareholders on board. But join the dots and this collapse is only a matter of time. Both oil and gas markets are at their weakest for many years, with momentum clearly pointing downwards. By late 2025, the Brent crude front-month contract finally fell below $60/bbl as supply far outpaces demand, while European (TTF) gas futures likewise could no longer sustain the €30/MWh threshold, as the well-documented shadow of oversupply looms large over both markets.
Critics say calling peaks is foolhardy, especially for complex systems. Maybe they’re right - it is easier to just wait and see. Unpredictable short-term impacts can easily move precise timings around. But the flows of the system - the overall direction of travel - is what really matters. In each case, the data is compelling. Let's look at each in turn:
Clean-Fossil Capex Doubling
Today's investments are tomorrow's reality. Financial flows reveal our future world. Capital expenditure on clean energies and associated infrastructure overtook expenditure on fossil energies several years ago, but now it has reached the double mark. Of $3.3 trillion being invested in energy, two thirds ($2.2 tn) now goes into clean energies and infrastructure, including electrification and efficiency technologies, with only one third ($1.1 tn) into fossil fuels.
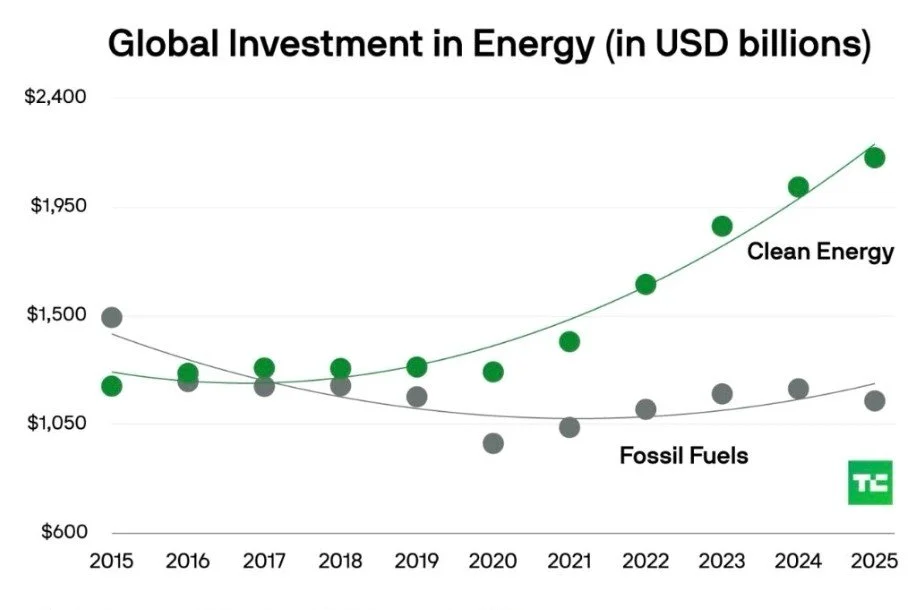
Global investment in clean energy (including associated grid infrastructure) vs fossil energy, 2015-2025. Source: TechCrunch, based on IEA data
The bifurcation is clearest from 2020 onwards - and has increased notably every year since. Given tipping points 5 and 6, peaking coal and oil demand, that 2:1 ratio is only likely to continue increasing from here, albeit unevenly. Capital chases returns: financial flows are inexorably shifting to capture the value in building, operating and optimising the new system. This investment shift is the surest proof of the inevitable transformation from hydrocarbon to electrified civilisation.
Many observers - albeit perhaps increasingly fewer - still struggle to accept this reality. But it only appears implausible with a certain cognitive bias: that is, a static, or retrospective, view of the current stock of energy infrastructure and production, built up over previous decades, versus the flows of new infrastructure that are rapidly creating the future.
This shift becomes even more stark when we consider that, according to the International Energy Agency (IEA), of that one third of expenditure dedicated to fossil fuels today, nearly 90% is for maintenance rather than growth. In other words, it is the investment needed for current production levels to stand still, once we factor in natural reservoir depletion.
Moreover, absolute monetary values don’t reflect falling unit costs. The same amount of money buys far more solar panels, batteries or EVs than even five years ago. Plus their performance is superior. That said, in other parts of the energy system prices are rising, not falling.
2. Clean power outpaces new demand
Over the first three quarters of 2025, incremental clean electricity generation finally caught up with incremental electricity demand - even though that demand itself has accelerated. Not just in a few cherry-picked countries, but globally. The full 2025 picture will emerge soon, but this is the culmination of a rising trend stretching back over a decade, so ultimately the inflection is not in doubt. Renewable capacity growth has steadily risen as a share of total net capacity growth (as shown in this chart). The same naturally follows for actual electricity generation.
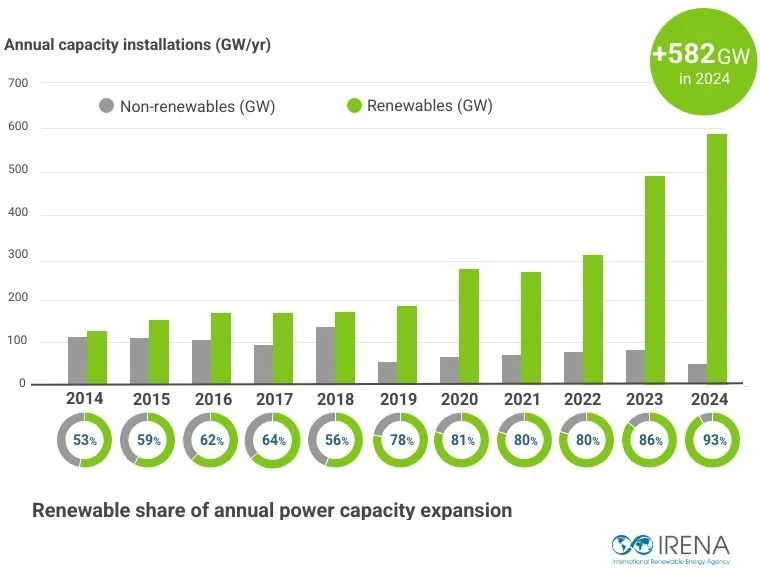
Annual growth in renewable share of power capacity expansion, 2014-24. Source: IRENA
Although this chart shows capacity rather than output, it is not hard to see how the figures in the next decade will exceed 100%. As renewable generation comes from fixed long-term infrastructure harnessing free resources of sunshine and wind, with more layered on every year, there is no realistic prospect of turning back the clock.

Wind and solar output catch up with incremental electricity demand. Source: Ember
This tipping point matters because it marks the structural moment (setting aside the exceptional 2020) that fossil generation starts to decline globally. The “additivity” critique of the energy transition points out that renewables and electrification have never made any absolute inroads into fossil energy demand - and incorrectly argues that must therefore always be the case. This argument is about to lose its credibility.
The two main drivers are cost and speed to market. While wind energy continues to play a vital role and its capacity is still growing at double digit rates, the real gamechanger is solar PV, where unit costs have fallen 90% since 2010. Over the past 5 years in particular, it has become increasingly cost competitive. The latest edition of Lazard’s Levelized Cost of Energy comparison shows utility solar PV costing $38-78/MWh versus $48-109/MWh for gas, where supply chain constraints have been pushing costs up.
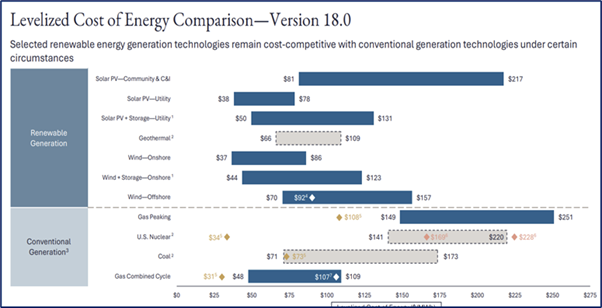
Levelized Cost of Energy Comparison v.18. Source: Lazard
As solar PV manufacturing capacity remains in substantial oversupply and is typically the fastest type of new capacity to bring online, that competitive advantage will likely extend. Falling gas prices will complicate that picture, but absent a substantial loosening of the gas turbine supply chain, it is hard to see a very strong recovery in gas generation.
Solar's growth over the 2020s to date has amazed even solar analysts, let alone everyone else. And while Chinese growth is slowing, at a global level we ain't seen nothing yet. The bulk of solar growth is still to come. It will come from the swathe of high irradiation countries across the world's central "sunbelt". These countries have clear economic and energy security reasons to substitute away from fossil fuel consumption, especially the imported version.
The solar growth story is already diversifying away from its heavy reliance on China. As it spreads across geographies and applications, solar is heading from bottom to top of the global generation league in just two decades. In 2010, it was just a rounding error on the global electricity generation map. By 2030, it will have overtaken nuclear, hydro and wind, before passing coal and gas in the early 2030s.
3. Hybrid power dominance
However, solar’s future growth depends on another crucial factor: battery complementarity. This is crucial in solving the challenge of variable output. The dominant economic template for new power capacity in much of the world is now “green baseload”: solar output firmed by battery storage. Either directly in homes, buildings and hybrid utility scale projects, or integrated as separate assets across grids.
This is thanks to a parallel cost decline in lithium-ion battery pack costs: 93% over the past 15 years, from $1,474/kWh down to $108/kWh. The combination of solar and batteries changes the game as it starts the era of round-the-clock clean power, responding to the higher energy demand growth across sunbelt countries.
This natural complementarity creates a positive feedback loop of mutual growth, accelerating scale-up. The long-term cost decline curves of these technologies are pushing them below the cyclical commodity cost curve, although this varies according to location and application. But it’s not just about cost. Three other important factors differentiate hybrid solar-battery systems over new gas and coal capacity: speed to market, energy security and environmental benefits of lower pollution and emissions.
These four factors in combination are why electricity capacity growth will increasingly be dominated by solar and solar-battery hybrid projects. In fact, even in the “petrostate” US, with an obstructive administration in place, over 90% of new electricity capacity installed in 2025 has been carbon-free (including >50% solar and >30% battery).
4. EV sales overtake ICE sales by 2030
Those are the tipping points we have already reached. Next are those arriving over the rest of this decade.
Electrification of road transport remains hotly debated, but the trend is increasingly clear. Globally, EVs (including battery electric vehicles as well as plug-in hybrids) now account for around 25% of new car sales (~20 million out of ~80 million annually), up from 1% in 2015 when they were just an expensive collector’s item. The share varies widely across different markets, based on prices, policies and incentives, with wealthy Norway by far the global leader at over 95% and Denmark now not far behind. The UK has now reached around 33% - but don’t be surprised to see it exceed 50% in the next 2-3 years.
For European car manufacturers, EVs are as much a threat as an opportunity - hence the lobbying of the European Commission to dilute the planned complete phaseout of Internal Combustion Engine (ICE) vehicle sales by 2035. Such policy decisions matter, of course, but will likely be overtaken by the realities of industrial economics thanks to fierce competition in China, the world’s biggest car market and locus of EV innovation.
While Europe vacillates, in China the EV tipping point is already here. In 2025, sales of new energy vehicles (NEVs) overtook other fuel types. The chart below illustrates just how quickly this has happened: effectively over the first half of this decade alone. With the force of Chinese manufacturing scale behind it, the momentum is unstoppable.
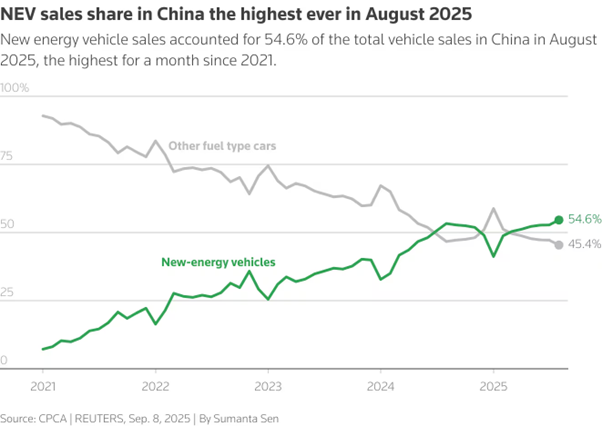
New energy vehicle sales vs other fuel type car sales in China, 2021-25. Definition of NEV: Battery electric vehicle, plug-in hybrid electric vehicle or fuel cell vehicle. Definition of other fuel type: internal combustion engine, mild hybrid electric vehicle, hybrid electric vehicle. Source: CPCA, Reuters.
And when it comes to consumer energy tech, where China leads, the world will ultimately follow, attracted by quality technology at mass market prices. Tariffs, regressive policies and other political headwinds can only delay, but not stop, this shift. That is why we now see many emerging markets at various stages of similarly rapid adoption curves - across southeast Asia, Latin America and parts of Africa too.
That makes the global tipping point only a matter of time. Rising EV sales versus falling ICE sales are two non-linear curves, so it only takes one geopolitical or industrial shock to shift the timing. But from 1% of global sales in 2015 to 3% in 2019 to 25% in 2025, EV sales are now on track to hit 50% by 2030, as adoption accelerates in non-linear fashion across many markets. Even two years ago, that might have seemed absurd. But by the mid-2030s, they will be far in the lead.
Western media tend to view this story through Tesla-tinted glasses, focusing disproportionately on the US market. But for now the US is becoming an outlier. This is really an emerging markets story. Those markets are less burdened by legacy car industries or where local EV manufacturers (OEMs) have emerged, or where the major Chinese OEMs are well placed to compete. For example, Viet Nam has gone from effectively no EVs five years ago to nearly 40% of new sales this year. Thanks in large part to its own domestic supply. Its share of EV sales has roughly doubled in the last year.
The rapid diffusion of EVs globally is a systemic shift - the result of several factors combining in real time. These include improved battery performance (leading to increased range), lower cost, faster charging times and the expansion of charging infrastructure. On the supply side, several countries see EV manufacturing as an industrial strategy to stimulate new growth and jobs. Plus, the electric mobility revolution is not just about cars - it is about bikes, vans and even trucks too. Ultimately, the EV is fast becoming for the ICE car what the invention of the smartphone was for Nokia and Blackberry handsets. Perhaps it’s no coincidence that Chinese mobile phone maker Xiaomi makes one of the fastest growing EV models in the world, the SU7.
5. Peak Oil
As covered in detail in Edition 13, this electric mobility revolution, with its continuous improvement in EV cost, performance and charging convenience means we are rapidly heading towards peak oil. Possibly even as soon as 2026, more likely by 2028, and almost certainly by 2030. Aviation and petrochemical demand will not compensate for falling gasoline and diesel demand. Expect the tapering off of demand shown in this IEA projection below to accelerate in the next 2-3 years as the electric mobility revolution gets fully baked into the numbers.
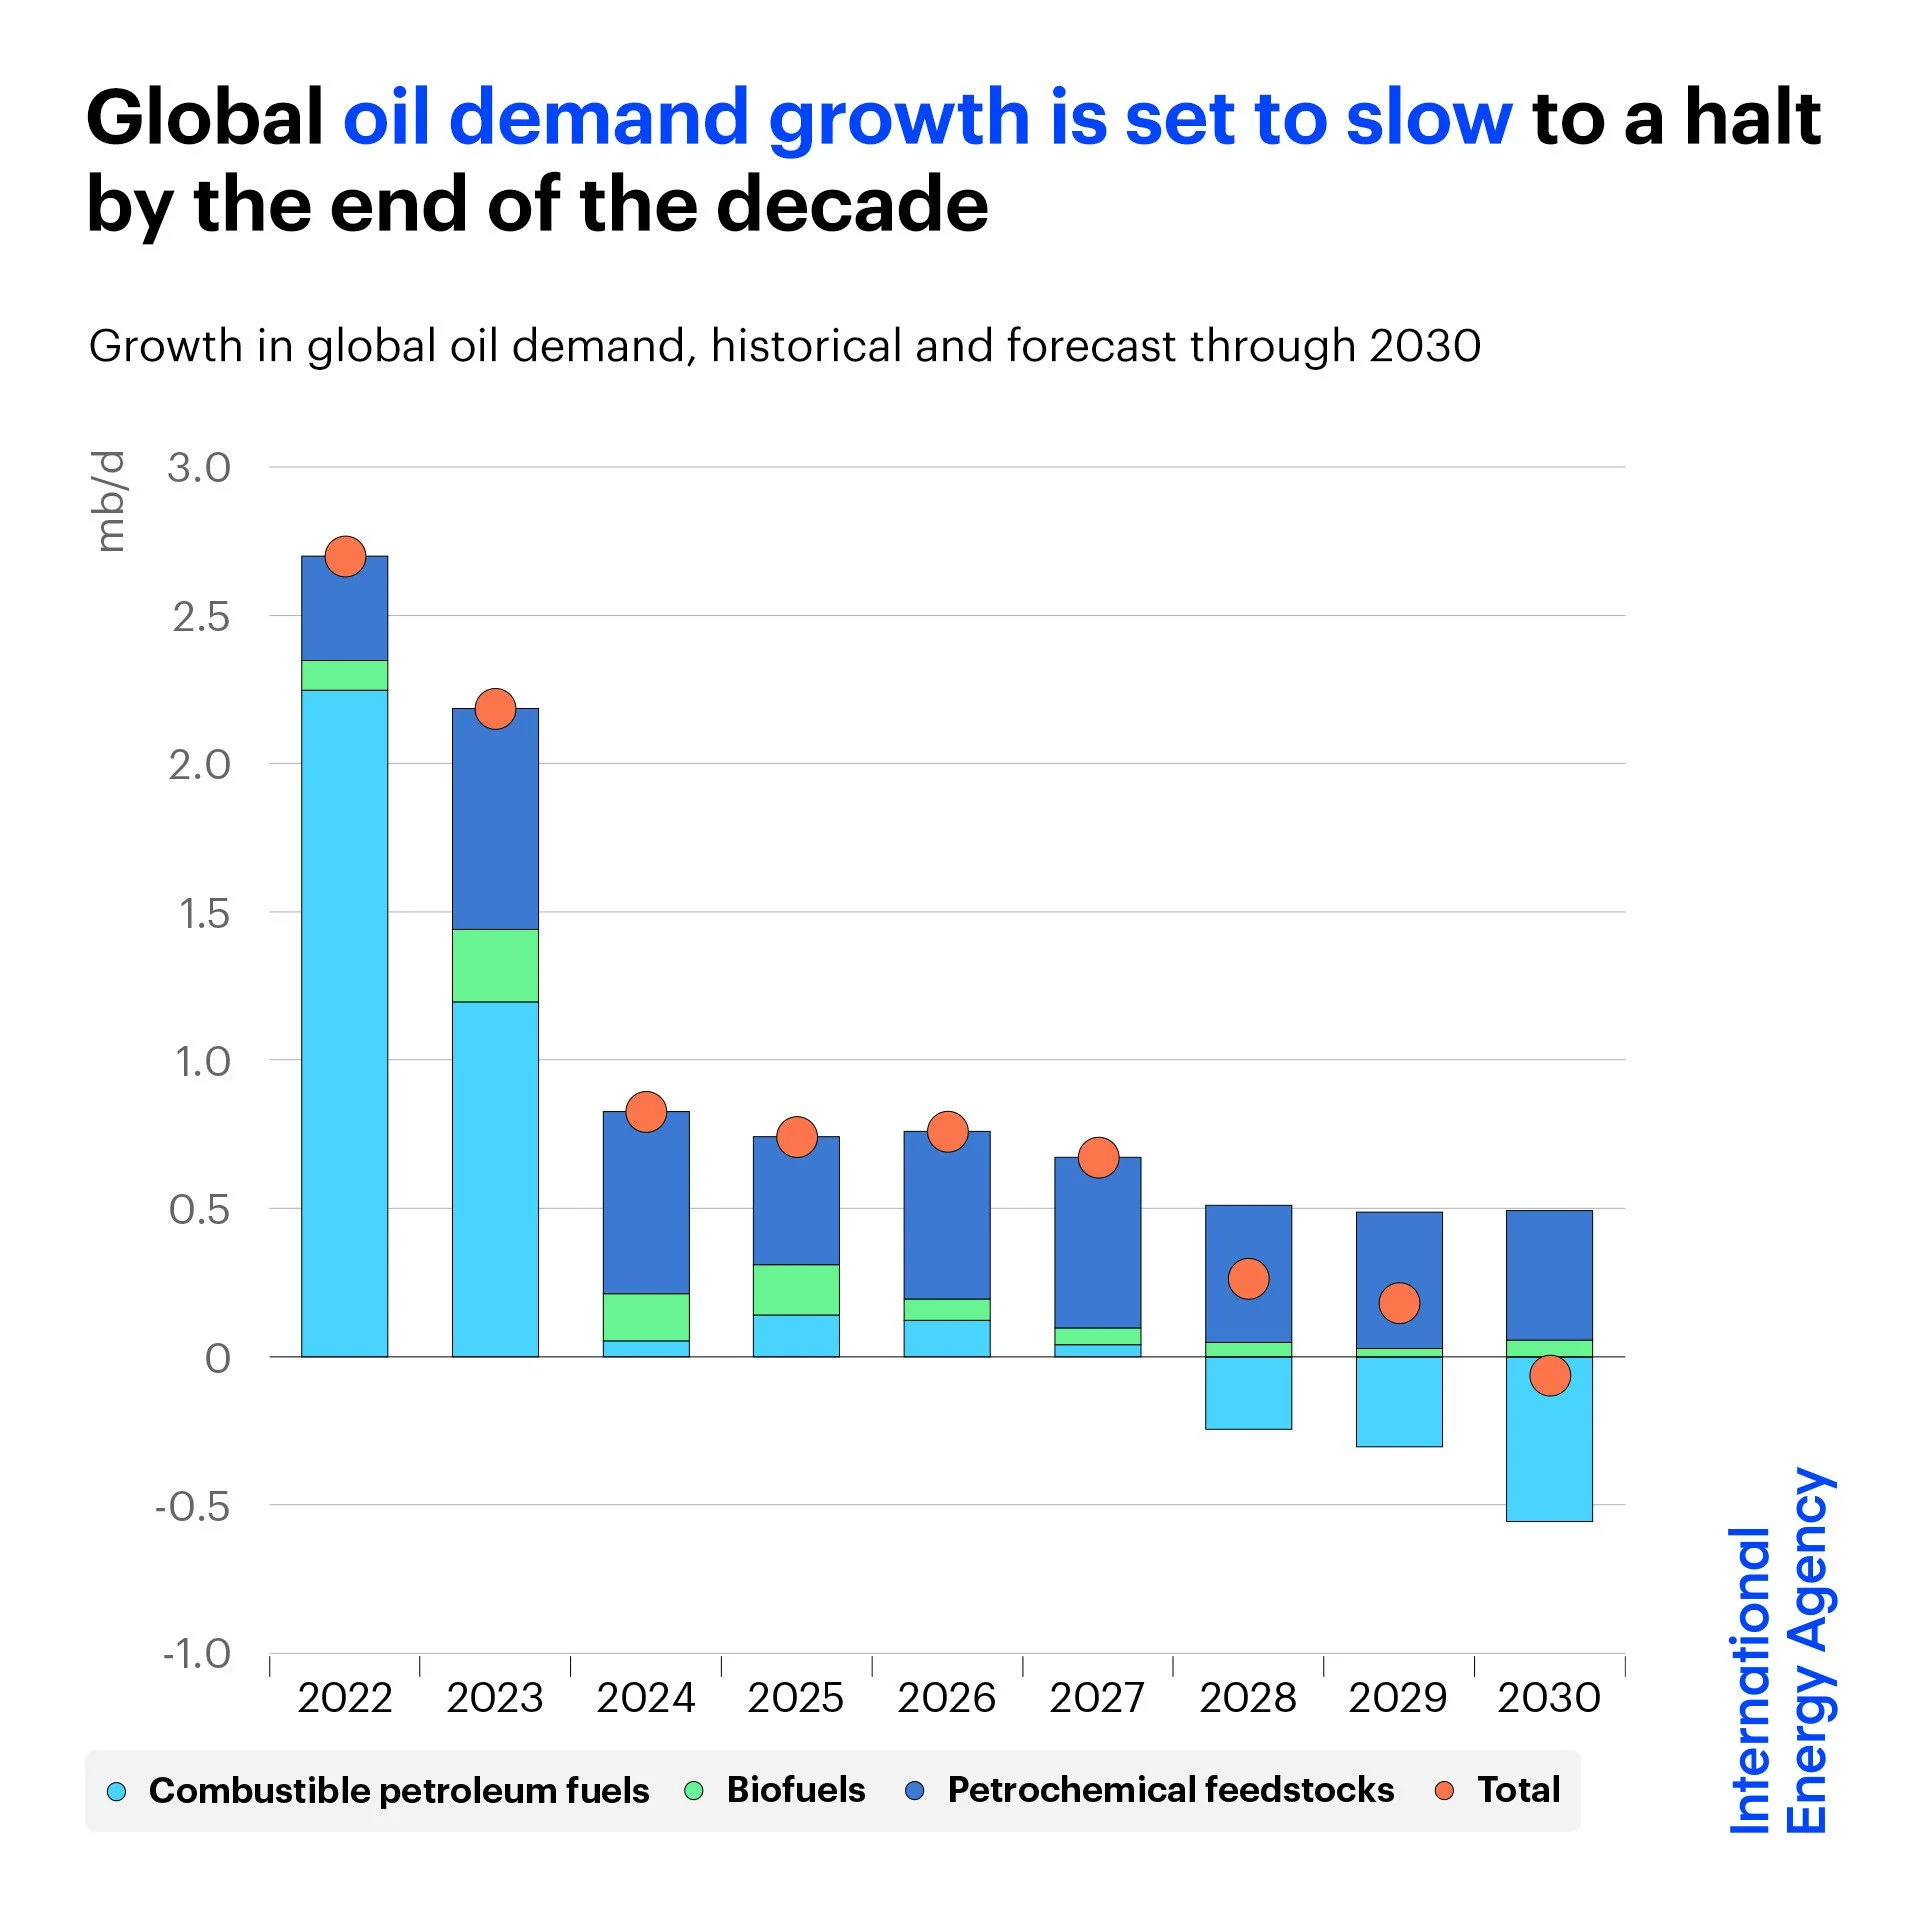
Oil supply and demand outlook to 2030 based on stated policies. Source: IEA
Of course, oil demand has already peaked in many mature economies, while peak ICE car sales arrived as far back as 2017. All net sales growth since then has come from EVs (including hybrid plug-ins). The oil demand growth case assumes India and other emerging Asian economies take the baton from China, but the signs are that simply isn’t going to happen.
Decelerating oil demand is also coinciding with ample new supply, creating a very soft market. By mid-December, the Brent crude front-month contract fell below $60/bbl, a threshold last seen in the recovery from the pandemic in early 2021. It has halved from the ~$120/bbl peak in mid-2022, and some oil analysts believe it may halve again in 2026, as supply far outstrips demand.
Oil’s energy density has been the key to its centrality and longevity as an energy source, with ~1700 kWh of energy potential in each barrel, the equivalent of several years of human labour. Being so deeply embedded within modern civilisation, it certainly won’t disappear overnight, but its post-peak downslope will not mirror its upslope in reverse. Peak oil is arriving around 170 years since commercial extraction started in the late 1850s. The next 3 decades will see a much steeper decline in usage. The value of its physical and financial architecture is predicated on continued growth in demand. That means a difficult and probably disorderly unwinding will follow. As this becomes clearer over the next couple of years, expect financial markets to reprice accordingly.
Shrinking demand shifts the economics decisively. Financial returns decline and investment withers. This has obvious implications for major integrated energy companies and petrostates. But it should come as no surprise. When superior energy technologies become available, incumbent industries decay and eventually collapse. There is an obvious but largely forgotten precedent: whale oil. In the mid-19th century, it became progressively harder and more expensive to source, leading to its relatively swift replacement by a cheaper and more accessible energy source. As energy analyst John Kemp has noted:
“The sudden competition from a plentiful source of cheap lighting in the form of petroleum-derived kerosene accelerated the industry’s decline. By the late 1870s the whale fishery had become a shadow of its former self.”
Quoting Alexander Starbuck’s 1877 report, the “History of the American Whale Fishery”, Kemp reveals how the whale oil industry became increasingly marginal with the rise of a more economic and accessible alternative:
“The expense of procuring [whale] oil was yearly increasing when the oil-wells of Pennsylvania were opened, and a source of illumination opened at once plentiful, cheap, and good. Its dangerous qualities at first greatly checked its general use, but, these removed, it entered into active, relentless competition with whale-oil, and it proved the more powerful of the antagonistic forces.”
Source: John Kemp: “Energy transitions - the decline of whale oil and the rise of petroleum” and associated chartbook, March 2024
6. Peak Coal
Perhaps even more significant still, we are also at the threshold of peak coal. Although long past its peak in many western markets, China has largely sustained global coal demand. The net result is that over the past decade, coal consumption has already effectively plateaued, from just under 45 PWh in 2024 to just under 46 PWh in 2024.
Going forward, as China rapidly electrifies and expands its renewable generation - even at a slower growth rate - coal’s resilience will finally come to an end. China’s official news agency Xinhua recently confirmed as much, predicting that its coal usage will peak by 2027, as its economy shifts and slows, with its population having also peaked. In fact, the latest IEA insight published in December 2025 suggests the peak is more likely to occur in 2025 or 2026.
China is still building new thermal power capacity, but it is actual generation output that really matters. Coal still generates 55% of Chinese power, but latest data suggests that has already peaked in both relative and absolute terms. According to analyst Qi Qin and the team at the Centre for Research on Energy and Clean Air (CREA), Chinese coal power generation was down 5.5% year-on-year in November 2025 (versus solar up 50% and wind up 37%). Steel and cement are the other major coal consuming sectors in China, but CREA also sees these as “almost certain” to fall for FY 2025 as those sectors are shrinking 11% and 8% respectively.
Of course, China is not the whole world, but it has been the biggest driver of coal demand in the past decade. This chart reflects how impactful a peak in Chinese coal demand will be at a global level.
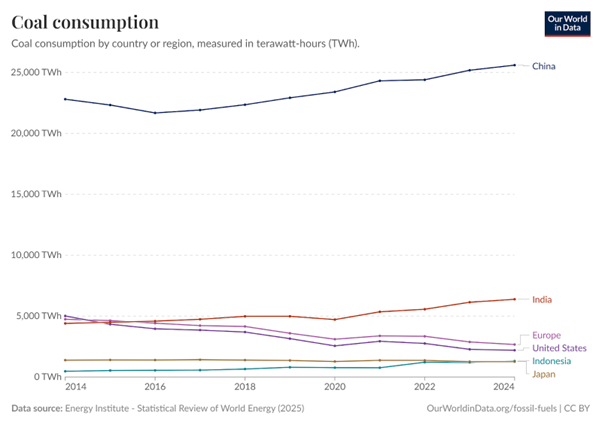
Coal consumption in major markets, 2014-24. Sources: Our World in Data, Energy Institute
The other important dynamic for coal is the leapfrog effect across so many emerging market and developing economies (EMDEs). Less legacy infrastructure facilitates the jump straight to cheaper, quicker and easier options, removing the prospect of further growth in coal demand. Clean electrification is a more efficient and secure growth model for developing nations, with the added benefits of cleaner air.
Global coal consumption now looks likely to plateau over the next 2-4 years, i.e. to 2029, as India initially offsets the start of the decline in China. The actual peak will most likely occur in that 2027-29 period. Over the 2030s, this decline will accelerate as electrification spreads and installed renewable capacity reaches multiples of its current level. This leads to a non-linear decline in coal consumption, falling much faster than its long arc of growth over the past three centuries.
7. Peak Emissions
This leads us to the last and perhaps most significant tipping point: peak annual energy emissions. We have already been at plateau per capita emissions for the past 10-15 years. The tipping points discussed above will combine to push metric that over the cliff. But for absolute energy emissions, the peak now looks likely by or even before 2030. Unsurprisingly, China is once again the swing factor.
At first glance, it might seem odd to call an impending peak in global energy emissions when their rise has been fairly uniform over recent decades. Global annual energy emissions have more than doubled over the past 50 years from 17 billion metric tonnes (GT/pa) CO₂ to an estimated 38.1 GT CO₂/pa in 2025. The trend has been very consistent, punctuated only by the 2008-09 global financial crisis and 2020-21 pandemic. However, embedded in this line is a more recent deceleration in emissions growth rate. And that deceleration will itself accelerate as the tipping points above take effect. By the end of this decade, once coal and oil are in decline, with economic growth ever more decoupled from them, energy emissions will logically follow.
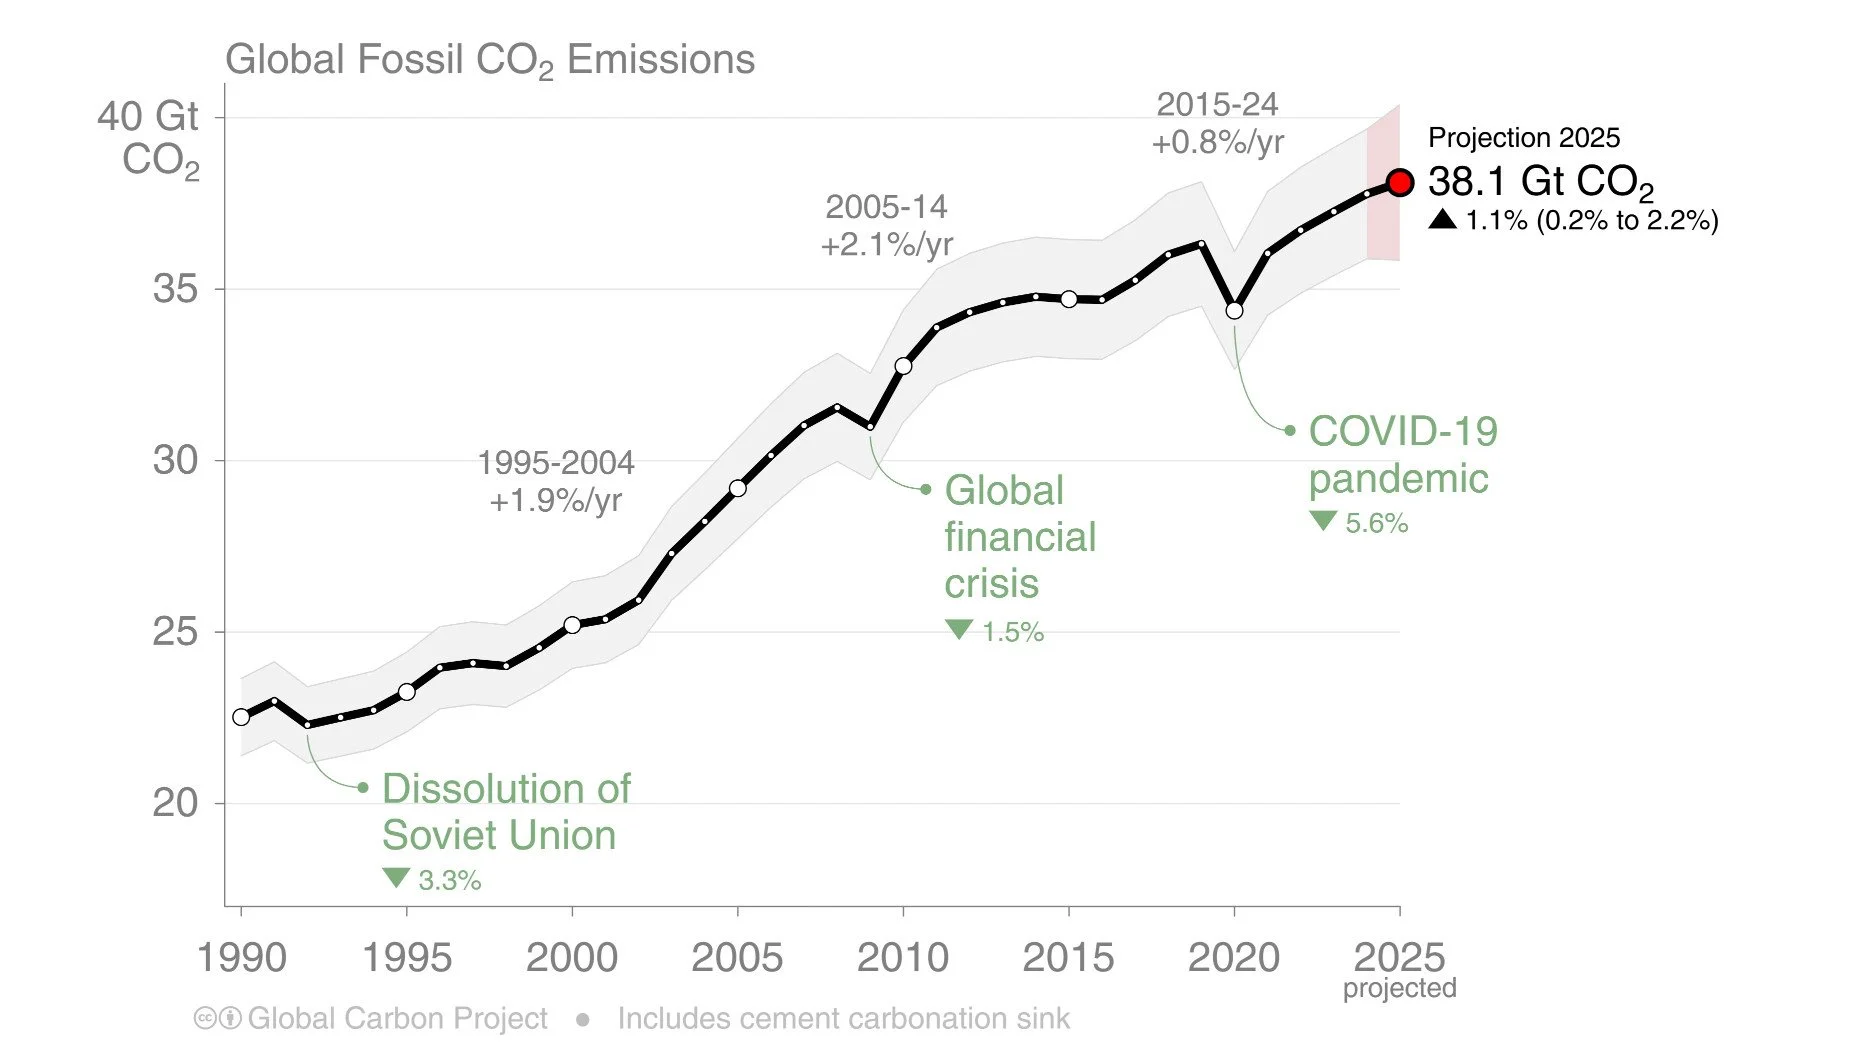
Global energy CO2 emissions, 1960-2025. Source: Global Carbon Project
Emissions levels reflect the rise in global population and GDP, partially offset by energy efficiency gains (energy usage per unit of GDP) and emissions intensity gains (emissions per unit of energy consumed). At a national level, the rise of China accounts for most of net global emissions growth since 2000:
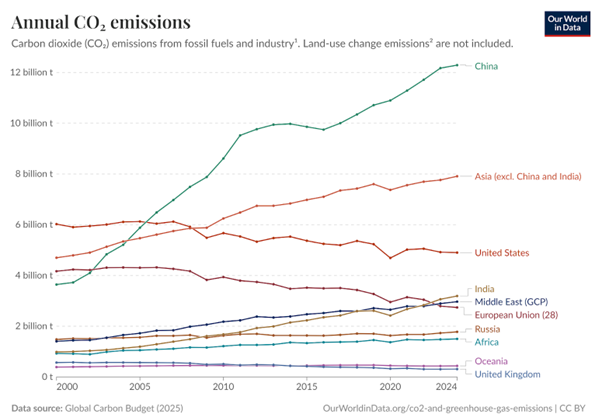
Annual energy CO2 emissions, 2000-2024. Source: Global Carbon Budget, Our World in Data
Replacing coal, mainly initially with gas and increasingly with renewables, has helped US and European emissions decline over the past two decades even as their economies grew. Recent US policy shifts may flatten this decline for the US, but with new electricity capacity still largely carbon-free, a rebound still looks unlikely. India’s emissions, meanwhile, are growing at just over 4%/pa over recent years, but remain less than a quarter of China’s annual total. The rest of Asia is now around two thirds of China, but is only growing at less than 1%/pa.
Zooming in on the past decade reinforces that China’s trajectory will largely determine the global peak. Not only because it accounts for nearly one third of the total, but also because China contributed most of the net emissions growth over the past decade.
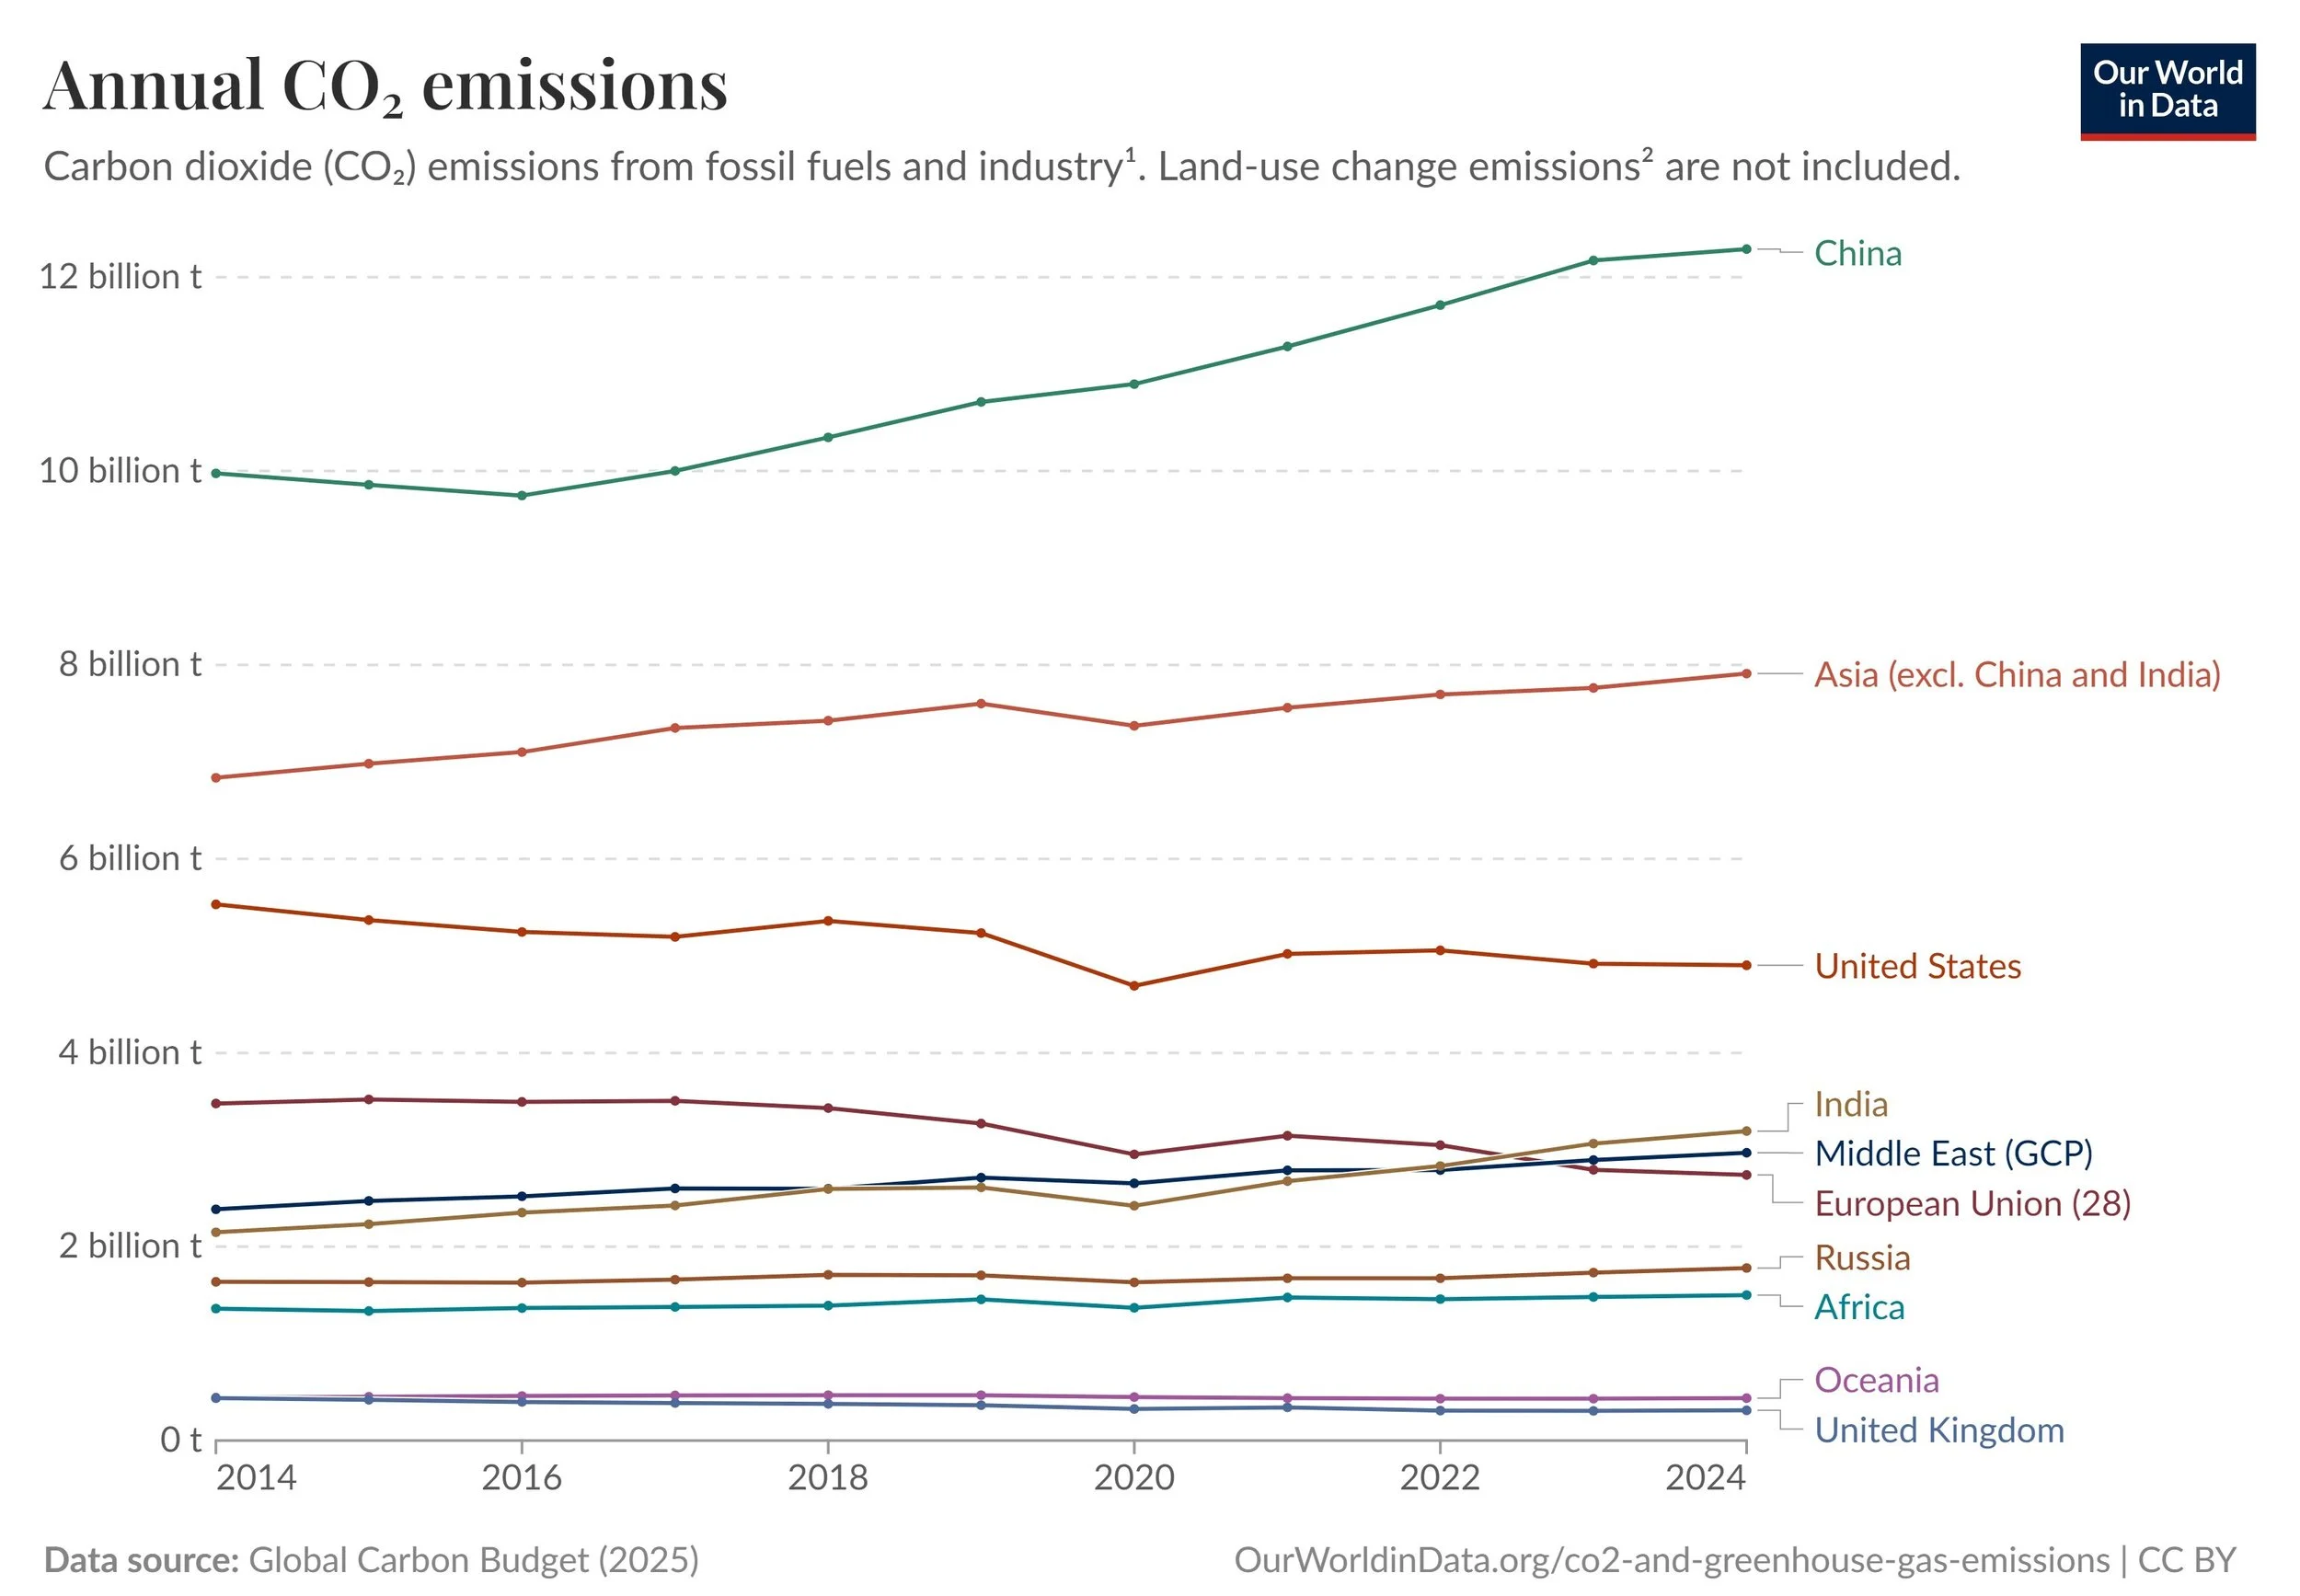
Annual energy CO2 emissions, 2014-2024. Source: Global Carbon Budget, Our World in Data
China is starting to break the link between growth and emissions. Its population has now peaked, so demographic growth is no longer a factor. And as electrification drives energy efficiency and the share of clean generation also rapidly increases, China’s emissions growth trend is now inevitably set to reverse. In fact, the last 18 months of data suggest that peak - or more accurately a brief plateau - may already be here.
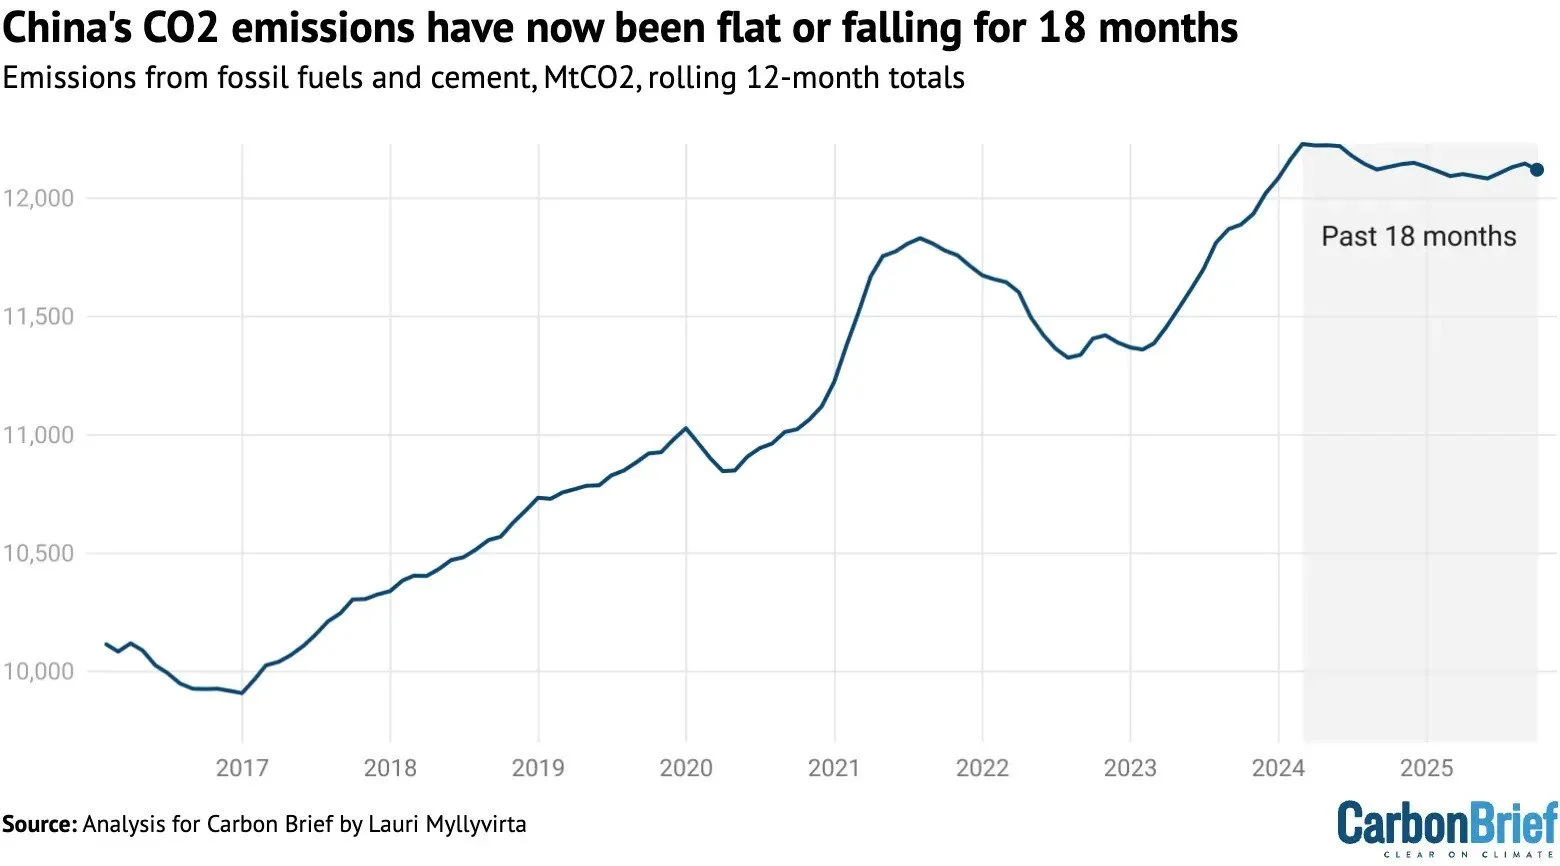
China CO₂ emissions 2017-25. Source: Carbon Brief / CREA
This is especially significant because China’s exports of electrification technologies are rapidly increasing. That will bend down the emissions curve across all other regions and accelerate the global peak, perhaps even to well before 2030.
But whichever year it does happen, this peak represents the high water mark of the legacy energy system. Given already baked-in climate change and high ongoing emissions, that’s clearly no great cause for celebration - perhaps more a psychological milestone at best. Rather than a collective response to climate change, it can be more accurately seen as an effect of China’s 21st century industrial and energy security policies. Intentionally or not, the biggest driver of energy systemic change has arguably been China’s oil and gas import dependency. This has been the fundamental motivator for scaling up electrified technologies into vast industries whose momentum is now spreading around the world.
Investment Implications
What does all this mean for long-term capital allocation? The key objective is to get aligned with the emergent mega-trend of electrification, and more specifically, at the points where incremental investment has the highest value.
In that context, here are the most relevant energy transformation investment themes that we will be investigating in more granular detail this year:
1. Grids & gridtech: Global grid investment reached ~$480 billion in 2025, but this is still not enough to keep pace with fast expanding renewable generation. There is an urgent need to close that gap. This implies increased flows over a sustained period into grid hardware, software and everything in between, from high and ultra-high voltage DC transmission to critical grid equipment (transformers, capacitors, switchgear, etc), to grid enhancing technologies like advanced conductors to smart appliances. This grid investment supercycle is of course now already well underway, and increasingly reflected in share prices.
2. Flexibility: as value shifts from power generation towards storing and flexing that power to maximise its impact. On the supply side, battery technology is improving fast, while installed capacity is likewise expanding at lightning speed. But the question remains as to what extent and how are battery energy storage systems a viable asset class for financial investors? Meanwhile, grid constraints also mean demand side flexibility’s time has come.
3. Mobility: transport electrification is a rapidly evolving and highly competitive space, but the prize is enormous. Intense competition within China will have a big global impact. Transport electrification will also evolve into mobile grid flexibility.
4. Critical minerals: the impact of the electrification supercycle on market fundamentals for key metals and minerals, including copper, lithium and silver among others, is a notable trend of recent months. We expect this momentum to continue, albeit with high volatility.
5. Industrial retooling: the electrification of global industry, especially those with lower temperature processes, is possibly the biggest driver of incremental power demand. This gets far less media coverage than AI but will ultimately matter more.
6. Built environment & HVAC: heating has always been a major component of energy demand, but it is increasingly accompanied by cooling as temperatures rise, solutions become more affordable and data centres expand. This implies steadily increasing long-term demand across the heating, ventilation and air conditioning (HVAC) sector, as well as industrial cooling soutions.
7. Intelligence, automation and efficiency: last but certainly not least, a deeper dive into the complex interplay between AI and energy is essential. In particular, the extent to which AI becomes not just a source of incremental demand but a form of energy efficiency, a grid enhancing technology in its own right. And what this might mean for those energy companies highly exposed to the AI investment cycle (or bubble if you prefer!).
Welcome to 2026 and the next phase of energy transformation.