

ENERGIZED: Investment Insights on Energy Transformation
Edition 16
The Good, The Bad & The Ugly: 2025 Top Takeaways & Predictions Review
26 January 2026
Please note: This newsletter is for general informational purposes only and should not be construed as financial, legal or tax advice nor as an invitation or inducement to engage in any specific investment activity, nor to address the specific personal requirements of any readers.
Key Takeaways:
So much happened across global energy transformation in 2025. Here’s our top five headlines for a handy 60-second catch-up:
Solar installations: 655 GW (+10%) = cumulative global total: 2.85 TW; solar generation: ~2,800 TWh (tbc), up >30% y-o-y, 9% share of global generation (from 1% in 2015)
Wind installations: 150 GW (+9%) = cumulative global total: 1.32 TW; wind generation: ~2,700 TWh (tbc), up ~7% y-o-y, 9% share (from 3% in 2025)
Batteries installed (stationary grid-scale & behind-grid): 315 GWh (+50%) = cumulative global total ~645 GWh
EV sales: 20.7 million (+20%), reaching 25% of total car sales (up from just 3% in 2020), cumulative EVs sold: ~80m
Grid investments: $479 billion (+16%) = 15% of global energy capex
In short, energy transformation is unmistakeably gathering momentum as it enters a pivotal phase where key tipping points occur.
Plus: 2025 may eventually be confirmed as the peak year for gasoline demand, fossil thermal generation - and possibly even overall coal demand too. Time will tell…
2025 Predictions Review
As full year 2025 data arrives, it’s now time to review last year’s predictions, before looking ahead to 2026 and beyond.
Forecasting is a challenging and imperfect discipline. Beyond the simple right or wrong outcome, Beyond the simple right or wrong outcome, the process of grappling with the future always teaches us something, even if that is simply humility and respect for complexity.
To be useful, a forecast should ideally be SMART:
Specific (to be actionable)
Measurable (based on clear metrics so it can be contextualised)
Ambitious (in scope, to maximise relevance)
Realistic (based on reasonable not heroic assumptions)
Time-bound (being right at the wrong time is the same as being wrong)
SMARTer forecasts are riskier, carrying more scope for error, but in this discipline lies the true value. So let’s see what we got vaguely right or wildly wrong, before sharing some learnings.
Summary scoresheet:
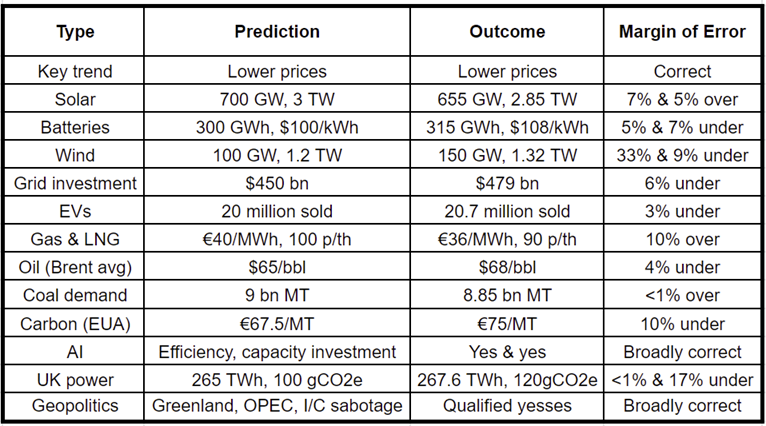
Lower prices: Our main prediction was that, with specific exceptions like Henry Hub, 2025 would be a “year of falling prices” across the energy spectrum. Oil and gas benchmarks did indeed fall more or less as predicted, as did power prices across Europe, in broad correlation with gas. Solar and battery unit costs also continued their decline.
While energy security and affordability were dominant criteria for energy financial flows, sustainability remains an indispensable factor. These three points of the classic “energy trilemma” increasingly overlapped. As the global energy system steadily but unmistakeably shifts from fossilised to electrified, smart capital is being allocated to sustainable technologies because they build greater resilience and long-term value.
Solar: slightly over-estimated. We forecast 700 GW global capacity additions, “bringing total installed capacity towards the 3 TW mark” - slightly ambitious versus the actual 655 GW. Cumulative installed provisionally looks to have reached ~2.85 TW, so last year saw an impressive 30% increase in solar generation capacity. (For context, in 2017 the world installed around 100 GW of solar, so we have seen 6.5x growth in annual installations over just 9 years.)
Batteries: slightly under. Predicting a breakthrough year for batteries was a no-brainer, with new projects getting consistently bigger and cheaper. Grid-scale and behind-grid battery energy storage systems (BESS) hit 315 GWh of installations (up ~50%), slightly above our 300 GWh expectation. Lithium-ion battery shipments rose by a similar rate to 2.28 TWh, of which 1.5 TWh was for EVs - the rest for stationary storage. So there is no shortage of capacity available for rapidly expanding new installations. BMI reports operational giga-scale projects increasing from 17 in 2024 to 46 in 2025 and as many as 150 more underway. We were however slightly over-optimistic on lithium-ion battery pack prices, which only reached $108/kWh rather than our $100/kWh target.
Wind: very under. We forecast that global capacity additions would be 100 GW, for a total installed capacity of 1.2 TW. The Global Wind Energy Council has now confirmed actual installations almost certainly exceeded 150 GW, for a cumulative total of ~1.32 TW. Approximately 100 GW of this was in China, but other regions grew fast too, with European installations rising 30% to 22.5 GW. Wind is a more mature sector than solar or batteries, but at a global level it continues to grow at a very solid rate, with 2025 installations just under 9% up on 2024.
Grids: slightly under. Our forecast of $450 billion investment was around $30bn too low. BNEF has reported a provisional actual of $479 billion. That 16% growth in 2025 partly reflects price inflation given ongoing supply chain shortages for key grid equipment. We expect to see continued double-digit growth in grid investments over the coming years, providing further tailwinds for critical equipment manufacturers.
EVs: slightly under. Our global EV sales forecast of 20 million (with 22 million as an upside case) was marginally below the actual outturn of 20.7 million, (20% growth vs 2024). What is clear is that EV adoption (including battery electric vehicles and plug-in hybrids) is scaling fast across many markets. Not least in China, by far the world’s biggest car market, where they reached 54% of new sales at 12.9m units sold, up 18% on 2024. We take no great credit in correctly predicting that BYD would take global output top spot, amid red-hot competition from rival Chinese manufacturers like Geely, Chery, XPeng and even mobile-phone maker Xiaomi, and that Tesla would slump down the charts. European EV sales actually grew faster than China, at 33%, albeit off a much smaller base, while the Rest of World (ex-China, Europe and N. America) grew by nearly 50%.
Gas & LNG: slightly over. We expected average 2025 realised prices of TTF €40/MWh, NBP 100p/therm, Henry Hub $3.40/MMBtu and JKM $13/MMBtu. Given how choppy and unpredictable gas markets can be, these were directionally right and proved reasonably accurate, with outturns ~10% lower than forecast. TTF averaged just over €36/MWh from a high of €58.26 in February down to a low of €26.51 in December - a fall of over 50% from peak to trough. Likewise, UK NBP averaged just under 90p/therm. We were also directionally correct on Henry Hub, which rose to average slightly higher than forecast at $3.64/MMBtu. Howver, gas prices proved less volatile than we expected, particularly over Q2-3. (For the uninitiated, gas prices are somewhat awkwardly priced in different units and currencies around the world, making them harder to compare. For more see our Price Explainer.)
Oil: about right. We forecast that strong supply along with tepid Asian demand “should pull Brent from its early year highs around $80/bbl to below $60/bbl.” That is essentially what happened, with Brent trending down to a low of $58.86 by mid-December, before ending the year marginally above $60. If we had remembered to give an average Brent prediction, on that basis it would have been around $65/bbl. The actual Brent front-month average for 2025 was $68/bbl. We also forecast that global gasoline demand would peak in 2025 - this looks likely but has yet to be confirmed.
Coal: slightly over. Our global demand forecast of 9 billion metric tonnes was slightly above the provisional total of 8.85 billion MT. In fact, in mid-December, the International Energy Agency (IEA) stated that 2025 is likely to prove the peak, before gradual annual declines over the remainder of this decade. CREA also reported that coal generation dipped in 2025 in both China and India, which strongly reinforces the IEA view. It now looks like coal demand will never reach 9 bn MT after all.
Carbon: slightly under. Our EUA price forecast of €65-70/MT proved a little bearish compared to the actual average of ~€75/MT.
AI: about right, albeit not that SMART. We predicted AI will get more energy efficient, mitigating fears around its energy demand. A month later, the Chinese DeepSeek AI model hit the headlines for doing exactly that. We also predicted AI will also help to optimise infrastructure performance and boost broader energy efficiency, but this looks like a longer-term dynamic. We also expected rapid growth in AI demand to drive new capacity investment across renewables, gas, nuclear and hybrid power projects. This certainly transpired, particularly in the US, where there was a strong correlation between electricity demand growth and solar capacity growth. However, AI remains a more marginal driver of new electricity capacity investment across the rest of the world versus industrial, heating, cooling and other core demand drivers.
UK nuclear: half right, half wrong. We forecast Sizewell B’s 2035 decommissioning date to be extended and Hinkley Point C’s start up date both to get deferred. The former did not happen, but the latter was pushed back to 2031, only 2 days after our 2025 forecasts were published.
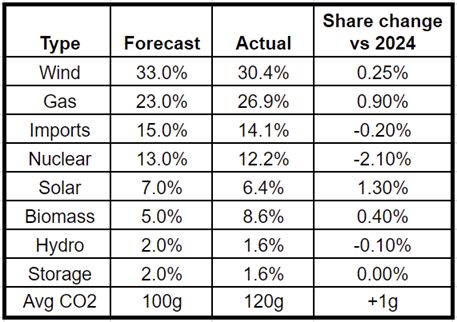
UK power mix: slightly under. Our 265 TWh total consumption forecast was very slightly below the actual 267.64 TWh (a 1% increase over 2024) - based on data from Drax Electric Insights. Stable demand over 2025-26 after years of decline implies that electrification is now counterbalancing efficiency and deindustrialisation effects, so UK electricity consumption may now start trending back up.
The breakdown by type proved broadly similar to 2024, with nuclear the most notable change. We were a little optimistic on wind versus gas output, and therefore also on emissions intensity, which barely changed at 120 gCO2e/kWh versus our 100g estimate. The final phaseout of coal in September 2024 made no material difference.
Solar did increase, with 2025 being the UK’s sunniest year on record and more capacity in place, but remains only 6.4% of total supply.
*NB: the figures above used Drax Electric Insights data, which seem to vary from the NESO data (need to investigate further).
Finally, geopolitics. Our 3 predictions were that Denmark would reject an “unbeatable offer” for Greenland from the US, that a major subsea interconnector in Europe would be mysteriously cut, and that an OPEC government would fall:
“Oil market softening will bring a government collapse in one or more OPEC country, bringing spiralling existential challenges for the cartel. The most likely candidates are either Iran, with Israeli airstrikes on nuclear and strategic targets a potential trigger, Algeria, in an echo of Arab spring revolutions, or Venezuela, where Maduro’s house of cards finally collapses under its own weight with a bit of external help.”
Trump got distracted from Greenland before eventually returning to it with a vengeance in early 2026. Although thankfully no major interconnector was interfered with in 2025, there was at least one smaller such incident in the Baltic Sea. Meanwhile, amid weakening oil and gas prices and ongoing sanctions, the Islamic Republic regime is clinging on like grim death in Iran, having suffered a significant loss of regional influence in Syria and Lebanon plus the ignominy of seeing its nuclear programme effectively wiped out.
Of course, a Venezuelan regime change of sorts did indeed happen, in bizarre circumstances, albeit just 3 days into the new year. What’s most notable is how the well supplied oil market barely blinked at the toppling of an OPEC government. Nor is the US takeover of Venezuela likely to have a significant long-term impact on oil markets, given the time and expense involved in reviving its beleaguered oil industry. If and when Venezuelan output ever materially recovers, global oil demand will by then already be in decline. Similarly, regime change in Iran would be slightly bearish long-term for both oil and gas markets, or more likely simply have no discernable impact at all.
Scoring and Learnings
Overall, we would score these predictions at about 7/10: solid, if not spectacular. Some forecasts were more or less right; most had a reasonable margin of error, but a couple required more thorough scrutiny. Certainly room for improvement in terms of scope, depth and accuracy.
So what did this exercise teach us in 2025? Here’s a few learnings:
The latest data is rapidly disproving the “energy additivity” thesis - the widespread assertion that fossil energy demand only ever increases no matter how much clean energy capacity is added. Coal and oil are in their very final throes of expansion. Their long arc of growth over the past couple of centuries is now decisively turning. This pivot period may be a more difficult phase of forecasting as future energy demand growth goes essentially electric. (In fact, the 19th century history of whale oil has always been a good counterpoint to the energy additivity argument.)
Solar and batteries will get more headlines as they continue their fast expansion, but wind’s contribution should not be underestimated. Global wind power capacity growth continues at just under 10%/pa despite the higher installed base and all the well-publicised issues with supply chain inflation, higher offshore costs and political opposition in the US.
Technology and economics are driving this transformation, within a broader geostrategic struggle characterised by the apparently accelerating demise of US hegemony and the rising power of the Chinese electrostate. China’s energy security policy has been a deep driver of new energy economics, while the US’ petrostate policies belie its slower but still clearly identifiable shift towards an electrified economy, overlaid by the race to dominate AI and robotics. Meanwhile, specific geopolitical events move markets often just in short, sharp and ultimately fairly inconsequential ways. The Israel-Iran war caused a brief oil spike but little deeper market impact, while the Venezuela raid didn’t even achieve that.
Always be mindful of bias and uncritical or wishful thinking. The analyst’s job is to work out what will happen, not what should happen or what you want to happen. Past data and present dynamics are often complex and non-linear, requiring impartial, empirical analysis and systems thinking, which can then enable punchy, anti-consensus conclusions where justified.
There is always so much more to discover. After 20 years working across energy and finance, every day brings new learning. The future is never a simple extrapolation of the past, and in energy that is arguably more the case now than ever. A year can contain a huge amount of change. The goal is not just to go deeper in each sector but to join the dots between them and synthesize the picture into an integrated whole. The challenge for 2026 and beyond is to make these predictions as truly SMART as possible. Enabling us to really put our money where our mouth is…