

ENERGIZED: Investment Insights on Energy Transformation
Edition 18
May the wind be at your back: why wind investment is bouncing back
20 February 2026
Please note: This newsletter is for general informational purposes only and should not be construed as financial, legal or tax advice nor as an invitation or inducement to engage in any specific investment activity, nor to address the specific personal requirements of any readers.
Disclosure: Ørsted was added to the Energized Portfolio in January 2026.
Key Takeaways:
Global wind installations hit a record 150 GW in 2025, while wind generation was on track for ~2,700 TWh/pa, up ~70% since 2020
A single 15 MW offshore turbine can today produce over 60 GWh/pa, or 6-9x the entire output of the first North Sea wind farm
But the wind industry has experienced its own “Gartner hype cycle”: a “peak of inflated expectations” in 2020-21 fell into the 2021-24 “trough of disillusionment”
The “slope of enlightenment” started in 2025 as developers and manufacturers refocus on financial discipline amid inflation, supply chain, market and regulatory risks
This will lead to a “plateau of productivity” supported by electricity demand growth and battery hybridisation:
By 2030, global wind capacity and generation will both rise by ~50% to reach 2 TW and 4,000 TWh/pa
By 2040, we expect wind to overtake gas as the world’s 2nd largest power source, after solar - even assuming much slower capacity growth rates
Three key dynamics drive this steady global expansion:
Chinese scale-up: a key pillar of its energy and industrial strategy, with 2025 installations up 50% to ~120 GW
European strategic autonomy: targeting 15 GW/pa across the North Sea region to underpin energy security and industrial competitiveness
Emerging markets adoption: rapid installation growth across developing countries as they pursue electrification and indigenise supply
Strong rebounds in major listed wind valuations have largely priced in this growth, but Europe’s long-term offshore buildout may support further recovery for Ørsted
More diversified wind exposure is available via wind-focused ETFs (WTFs?!), including FAN, WNDI and WNDG, albeit all are already up ~50% over the past year.
Wind’s industry cycle has turned
“Too expensive! Too unreliable! Too ugly!”
Is there any more hated industry than wind? There’s seemingly no shortage of critics happy to write it off as a financially ruinous folly.
There’s no denying it’s faced some serious challenges. Supply chain friction, cost inflation, staff layoffs, failed bid auctions, project delays and cancellations have made it an investment minefield since 2021. Throw in recent downturns in wind speeds in key markets and across the Atlantic, the cherry on top: the one-man ideological crusade against “money-losing windmills”.
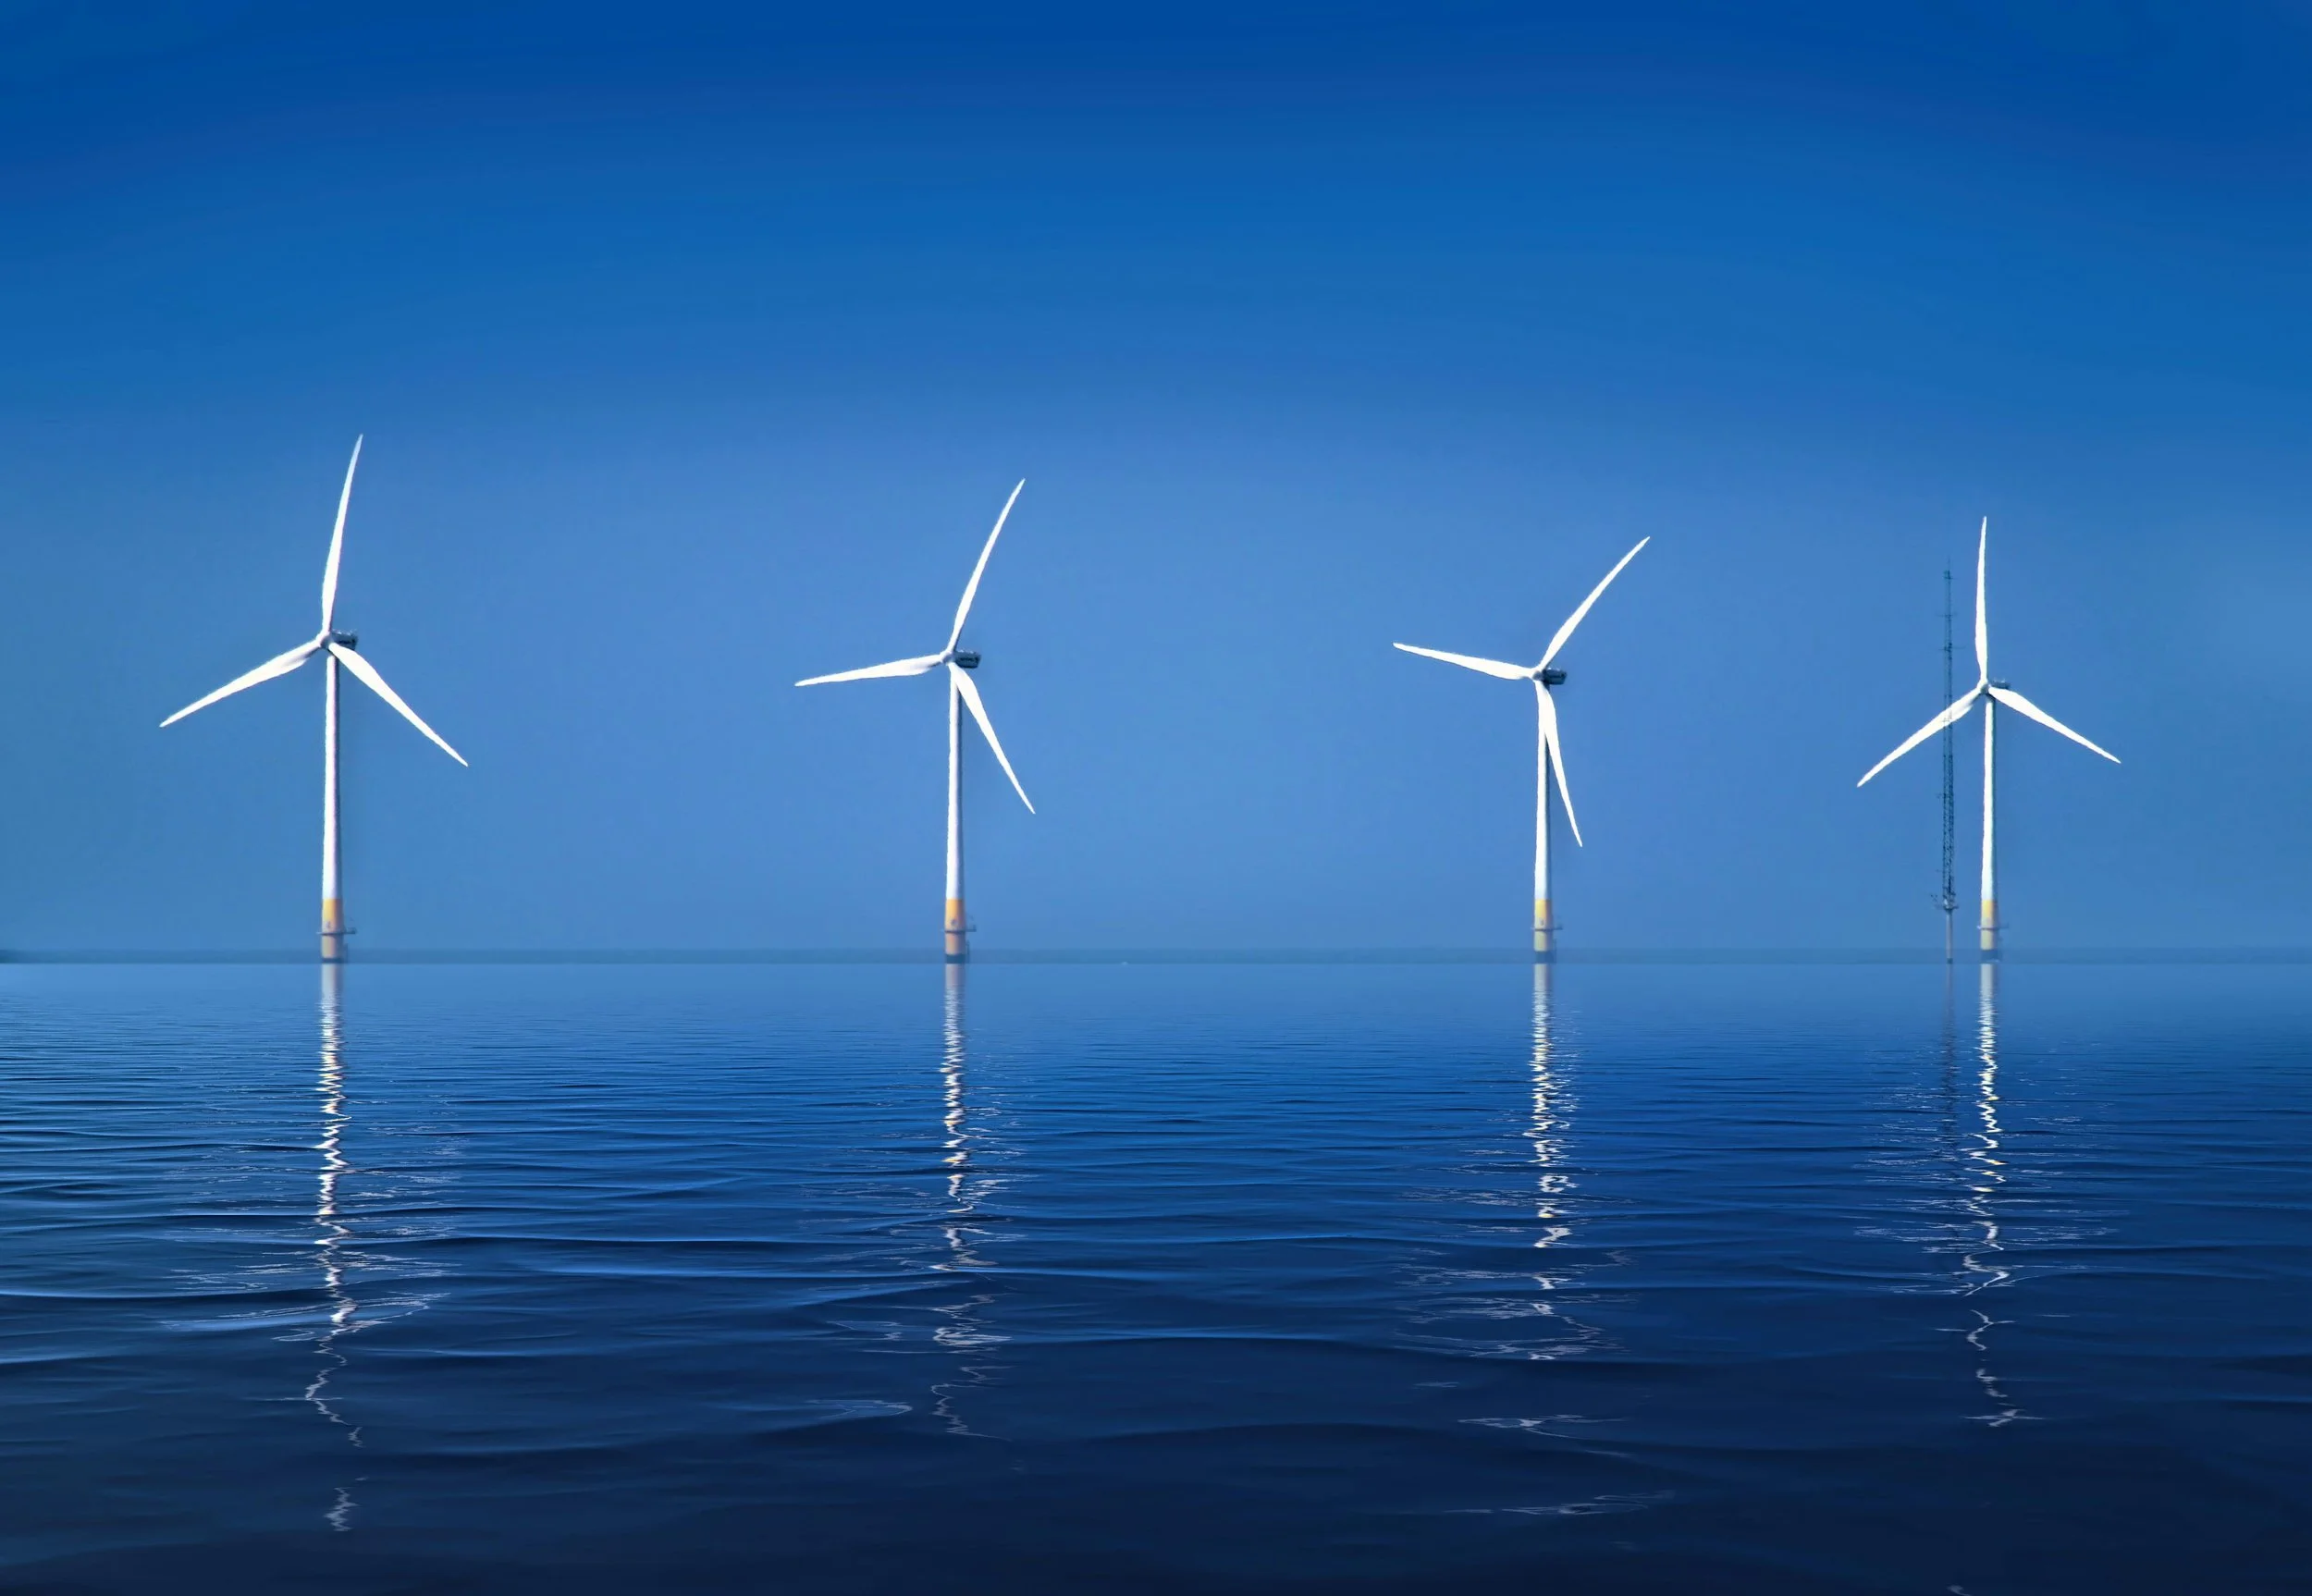
Can such a troubled industry really play a big role in our energy future? The answer is yes. Negative headlines obscure enormous progress. Take the Oweninny expansion in County Mayo, on Ireland’s west coast, which is replacing the Bellacorick project built in 1992. Each of its 6.5 MW new turbines has more capacity than the old wind farm’s entire 21 turbines.
This industry is now physically unrecognisable from previous decades. But it has also been experiencing its own version of the “Gartner hype cycle” - a commonly perceived pattern for technology-based industries:
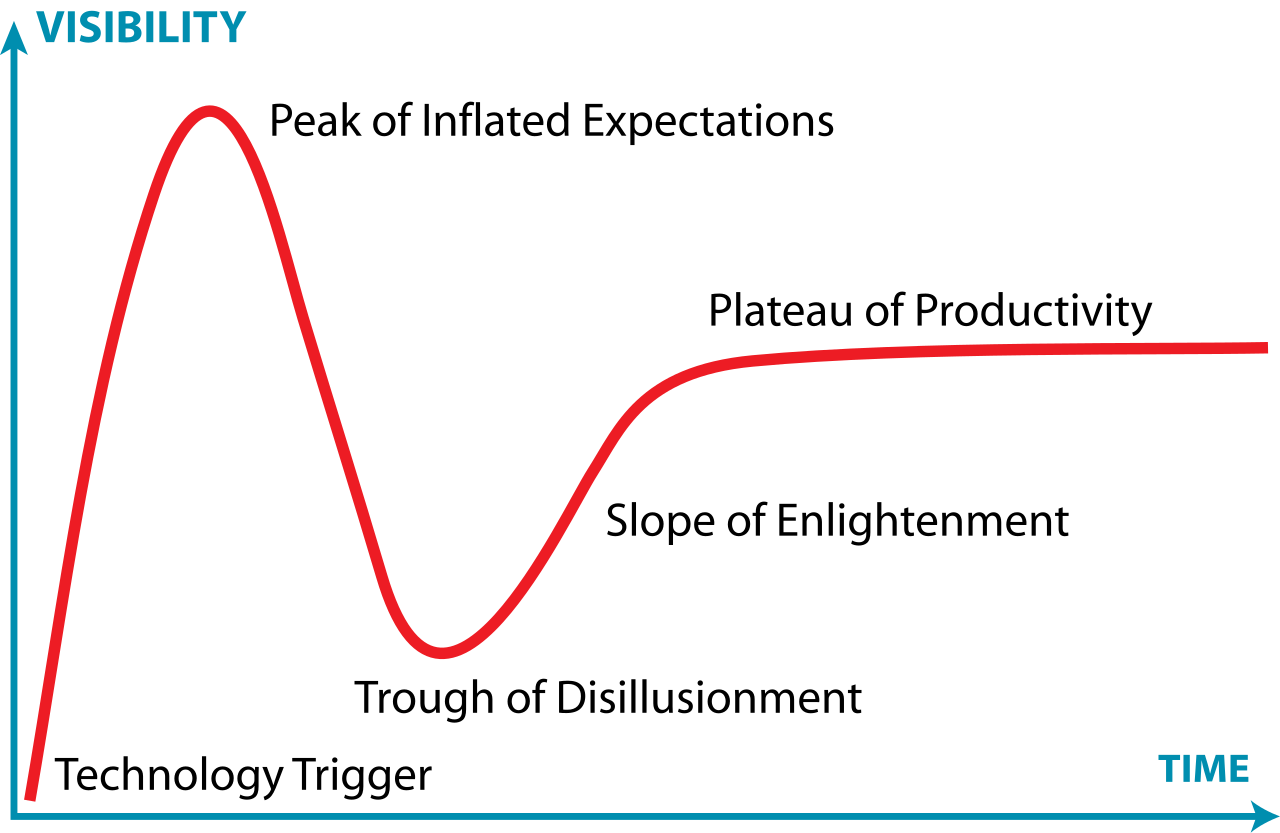
The classic Gartner Hype Cycle
Stage 1: “Technology Trigger” (2000-15)
As technology advanced and turbines grew in capacity and efficiency, the industry gradually expanded. Policy support in key markets helped drive scale and momentum while unit costs declined, leading to steady expansion.
Stage 2: “Peak of Inflated Expectations” (2015-21)
This has been covered in much greater detail elsewhere, but essentially, low interest rates, government-backed clean energy mandates and a rising sustainability agenda accelerated capital deployment and competition for assets even where returns remained limited. Expectations eventually accelerated ahead of reality, peaking in 2020-21.
Stage 3: “Trough of Disillusionment” (2021-24)
Then reality hit back. The pandemic, invasion of Ukraine and energy crisis period brought rising inflation and interest rates accompanied by supply chain pressures, exposing wind’s capex-heavy financial profile. The drive for scale ran into operational obstacles. Developers struggled to afford high up-front seabed concession payments charged by governments.
These factors pushed up capital costs, affecting project economics and causing delays and cancellations - slowing down European progress in particular. The levelised cost of offshore wind rose by 50% in real terms from €64/MWh in 2020 to €95/MWh in 2024.
Investor sentiment swung back sharply from enthusiasm to scepticism. Project certainty now trumped growth potential. Who could actually deliver competitive and timely projects backed by secure grid connections? Rising curtailment also complicated the investment outlook. By late 2024, sentiment was rock bottom and wind company share prices had tanked. From its peak in January 2021 to trough in August 2025, industry leader Ørsted fell by an ignominious 87%.
Stage 4: “Slope of enlightenment” (2025-27?)
However, the cycle has begun to turn. Wind has emerged as critical for energy security amid the strategic imperative of electrification. It remains a key element in more resilient, reliable and affordable energy systems - alongside solar, storage, expanded grids and demand flexibility.
The EU faces a glaring strategic vulnerability: it still imports nearly 60% of its total energy - largely due to importing around 80% of its gas demand. This import dependency has swung from an unrepentant Russia towards an increasingly hostile US. Energy security has become an urgent priority in a world of unpredictable enemies and unreliable friends. The long-term solution is twofold: electrification and maximising local energy production.
This is especially true for large energy importers like the UK and Germany who desperately need to support local industries. Access to affordable energy is critical for industrial competitiveness. Norway has vast hydropower resources, France is the leading nuclear power, while southern European countries are much better placed for solar. North Sea nations must evolve from tapping the resources buried underneath the sea to the less energy dense but more accessible resources flowing above it.
This explains why, in January, nine northern European governments made a big statement of intent: the Joint Offshore Wind Investment Pact, or Hamburg Declaration. The vision: “transform the North Sea into the largest clean energy hub in the world.” The shared ambition is to enable a co-ordinated European offshore wind buildout of 15 GW/pa, ultimately reaching 300 GW across the region by 2050 - 10x the North Sea’s current 30 GW capacity.
To succeed, this strategy must provide developers, supply chains, investors and lenders with clear and predictable investment frameworks. That includes:
Speeding up planning and permitting decisions
Leveraging multilateral capital to stimulate private investment
Establishing national and cross-border Contracts for Difference (CfDs)*
Facilitating the growth of trans-national power purchase agreements (PPAs)
The growth of the UK wind sector shows how essential CfDs are for consistent investment. CfD-backed projects typically enjoy a cost of capital 2% lower than than merchant* projects. That makes them much more bankable (70-80% debt-financed vs only 30-40%).
A big increase in European offshore installations is already planned over the next decade. But Hamburg promises to accelerate the North Sea’s evolution from oil rigs and gas platforms to a sea of gigascale wind farms. To maximise utilisation, these will need to be integrated into an expanded array of high-voltage interconnectors and “hybrid offshore facilities”.

Proposed offshore capacity expansion in Europe. Source: Ørsted, April 2025
For the “slope of enlightenment” phase to create a more robust industry, scale needs to come with financial discipline. The trough of disillusionment taught developers to focus on value as much as volume - for example, by standardising designs, rather than installing ever-larger turbines.
Stage 5: “Plateau of productivity” (2028-beyond?)
This industry volatility, plus the dramatic rise of solar, has perhaps distracted from wind’s global progress. Since 2020, global capacity has grown at an average 18%/pa, albeit quite unevenly, lifting its share of electricity generation from 6% to 8.5%.
Wind’s future growth rate will certainly be slower than for solar or batteries. It lacks the same degree of modular scalability, cost declines, location flexibility and installation speeds. But the next decade will still see the steady rollout of gigascale (1 GW+) projects onshore and offshore, to complement other sources. This will be underpinned by stronger high-voltage transmission networks and fast-expanding grid-scale storage, with battery hybridisation becoming standard as battery costs continue to fall. Co-location supports utilisation and therefore financial returns.
China’s wind expansion
The country underpinning this growth is of course China, as it doubles down hard on electrification and renewables as part of its “all of the above” energy security strategy. In 2025, China’s wind output grew 14%. But the scale of new capacity additions points to even faster growth ahead: provisional data suggests it added an enormous 119 GW of new wind installations out of a new record global total of around ~150 GW.
That’s 50% more than in 2024. In physical terms, it equates to 17,000 individual turbines. And this doesn’t look like a one-off. Analysts at the Centre for Research on Energy and Clean Air (CREA), which tracks Chinese energy policy closely, sees the country entering a “new normal of over 100 GW per year growth”.
At around 10% of China’s power generation, there is plenty of scope for further Chinese wind expansion, especially in lesser populated western regions that are being connected to eastern megacities via new ultra-high voltage transmission lines. Meanwhile, the East and South China Seas collectively form the world’s largest offshore wind province.
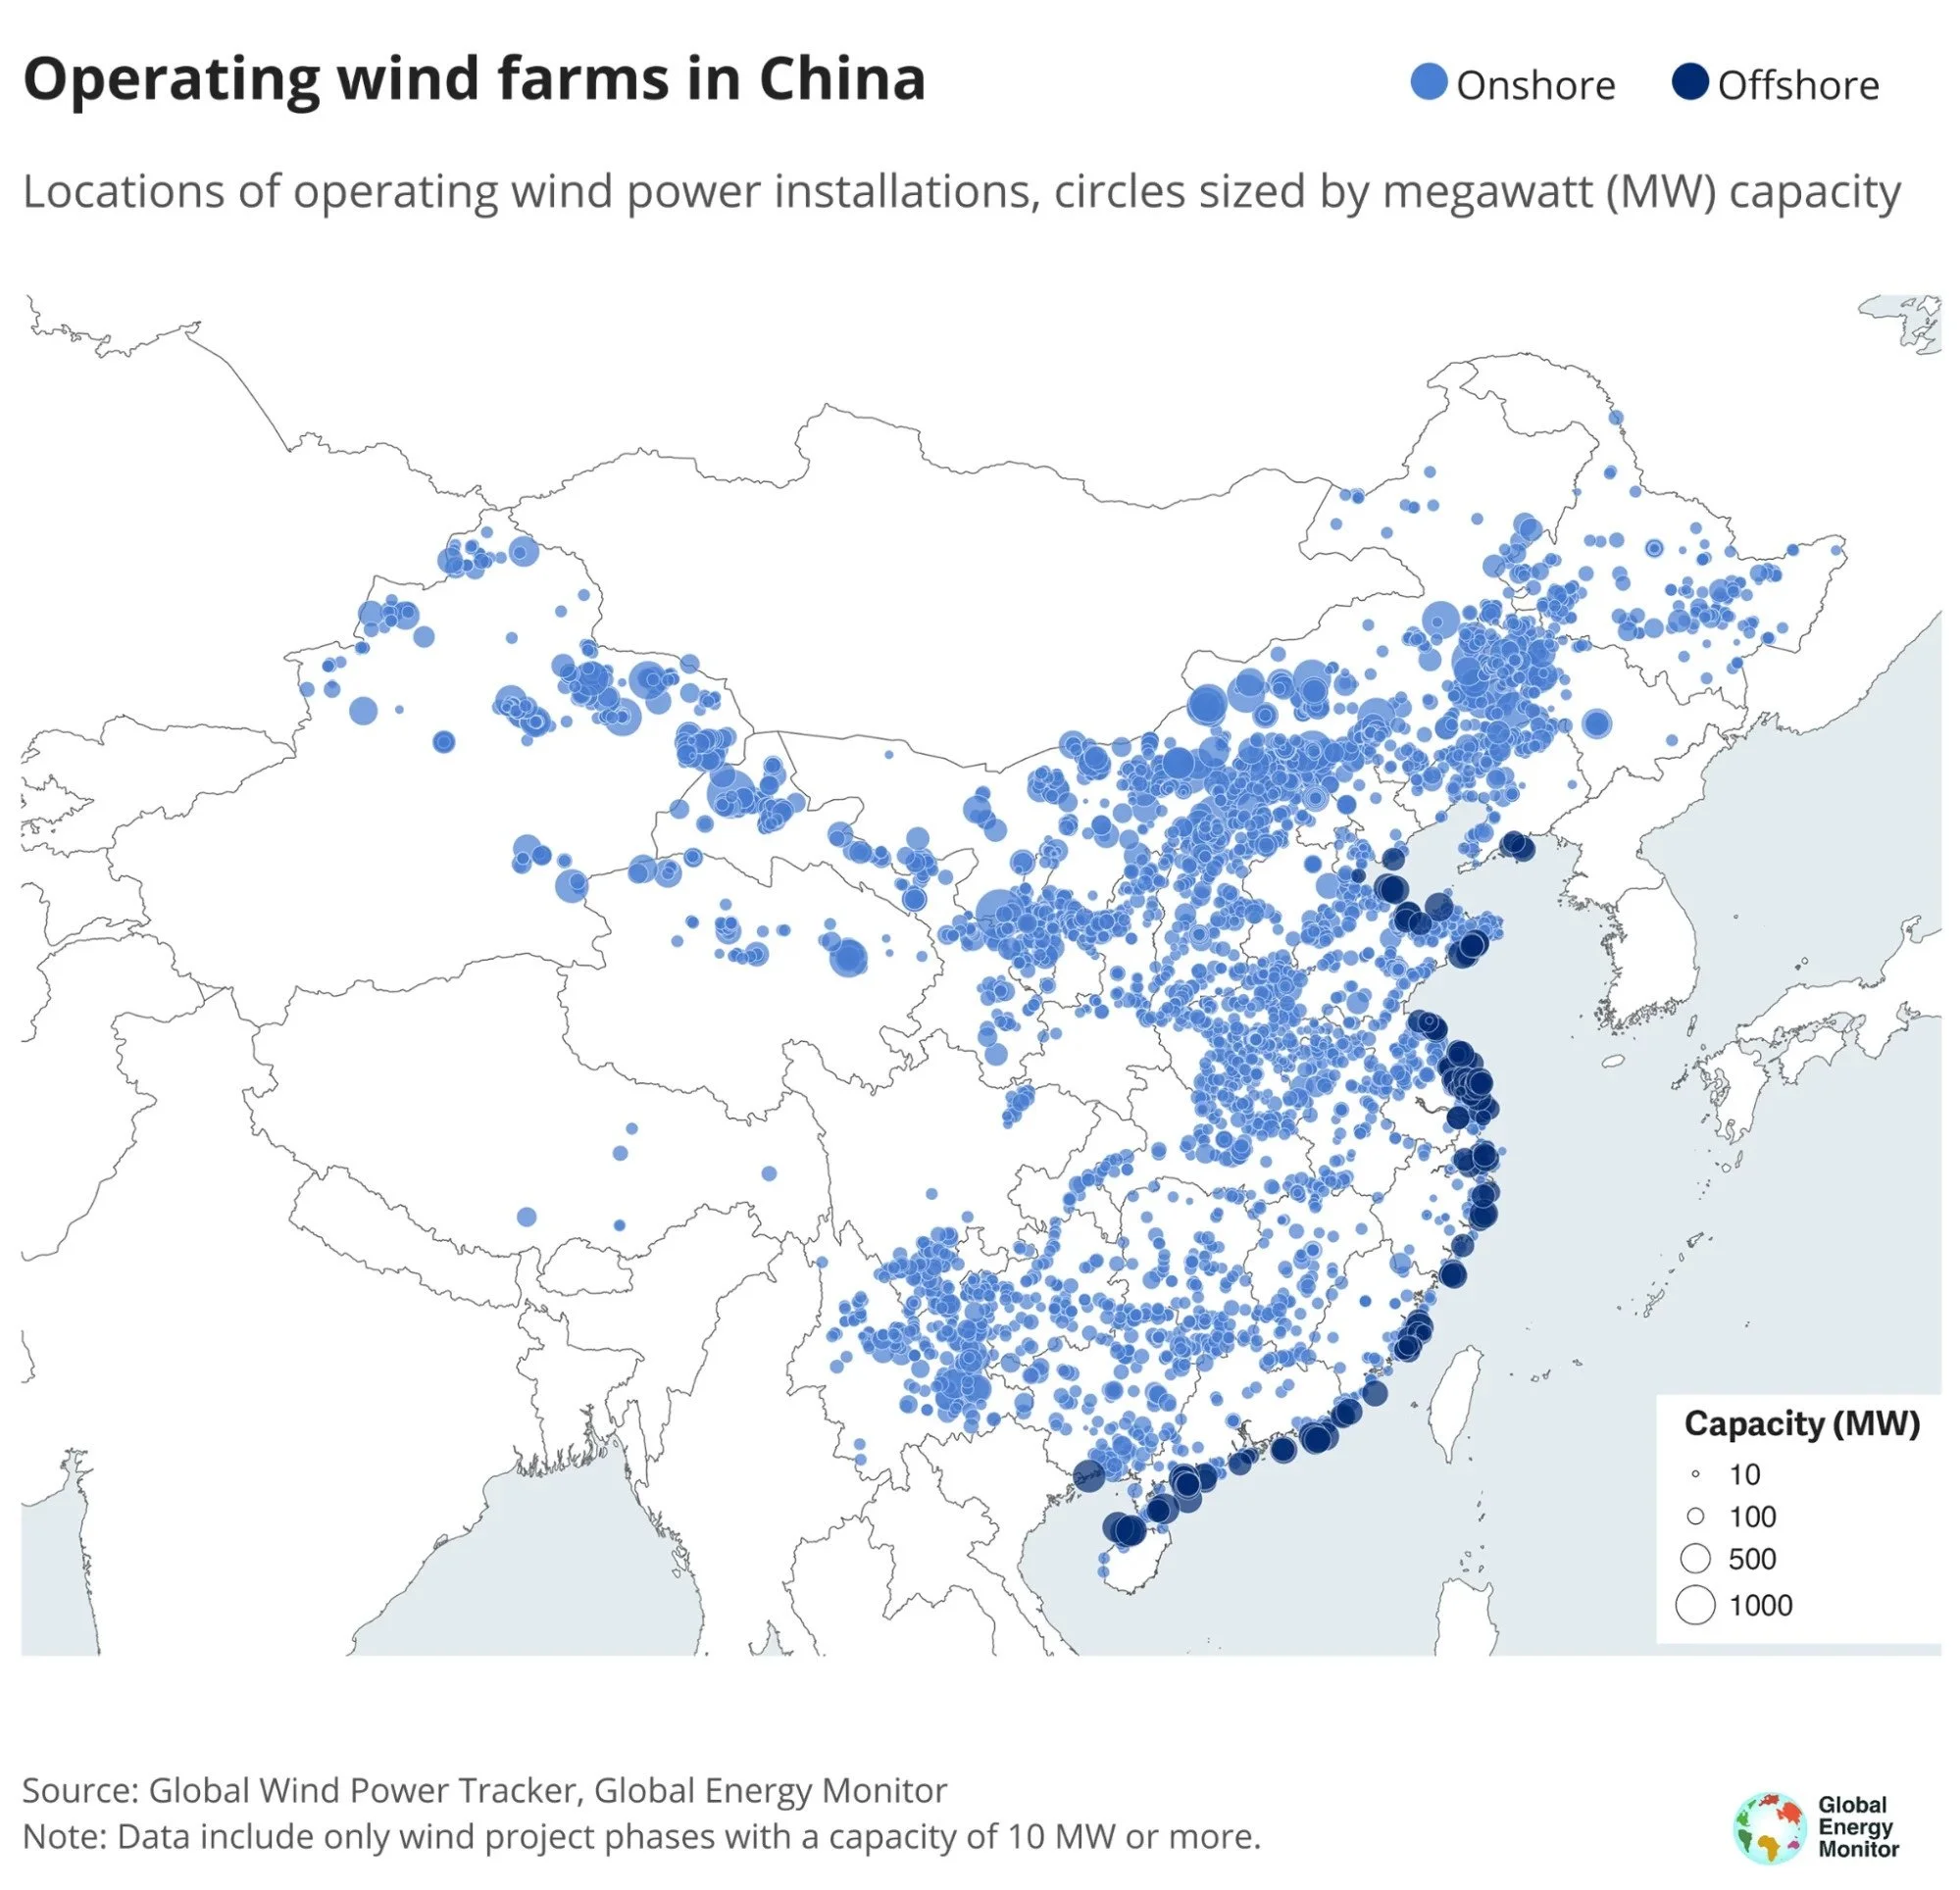
Operating wind farms of >10MW in China. Source: Global Energy Monitor
The global scale-up still has much further to run
The plateau of productivity will be underpinned by Chinese and European competition to roll out larger turbines across bigger projects. Unlike solar and batteries, wind remains one industry in which European companies can still see ways to compete.
Today’s gigascale offshore projects harness wind resources far more efficiently, thanks to turbines of up to 15MW or even 20MW, versus less than 2MW typically seen 25 years ago. Hornsea 1 was the UK North Sea’s first gigascale project at 1.2 GW. Now that is the average size for all new North Sea projects. When fully built, SSE and Equinor’s Dogger Bank A, B and C will claim to collectively form the world’s largest offshore wind farm at 3.6 GW. That brings serious scale, sufficient to power 6 million homes annually, or around a quarter of all UK homes.
While the focus in Europe has shifted towards standardising turbine sizes to enable more efficient expansion, in China the relentless energy quest continues to test new frontiers. China Three Gorges recently installed the first 20 MW turbine, manufactured by Goldwind, at the Zhangpu Liuao Phase 2 offshore wind farm. This 174 metre tall turbine, with a rotor diameter of 300 metres, is expected to generate over 80 GWh per year - the annual demand of 44,000 homes. Not to be outdone, Dongfang Electric is now testing a 26 MW model, while Ming Yang is even trying to develop a 50 MW twin-headed floating turbine…
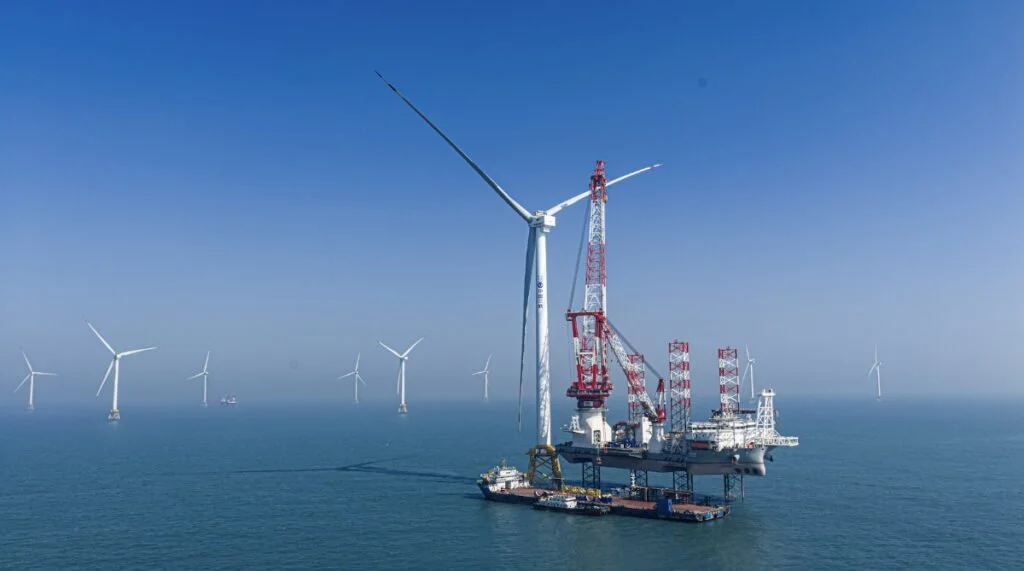
Installation of Goldwind’s 20 MW turbine at China Three Gorges’ Zhangpu Liuao Phase 2. Source: Zhou Junwei / CTG
Chinese offshore projects are generally a similar size to new North Sea ones, in the 1-2 GW range, with the 1.7 GW Yangjiang Shaba the largest to date. Onshore, however, China is shooting for another order of magnitude: the Gansu project in the northern Gobi desert is targeting a mind-boggling 20 GW - more than the UK’s entire onshore capacity.
China will lead the way in absolute installation numbers for the foreseeable. However, growth rates across key demand regions including south and south-east Asia, Middle East, Africa and Latin America are also already rising to meet considerable unfulfilled potential. As with solar power, Chinese manufacturing scale, originally more focused on its domestic market, lays the foundations for a new phase of broader international growth across these markets.
Wind’s long-term global growth
The 18%/pa installation growth rate over 2020-25 adds up to a near-70% increase in global output over that period. As absolute numbers increase, we assume this growth rate will fall to 8%/pa over the next five years. That would still take annual installations beyond 200 GW/pa and lift cumulative capacity over 2 TW by 2030, from 94 GW and 0.75 TW in 2020. Likewise, generation would exceed 4,000 TWh/pa, up from 1,600 TWh/pa in 2020. That represents 150% output growth over this decade alone and takes wind from 6% to 11% of total global electricity generation.
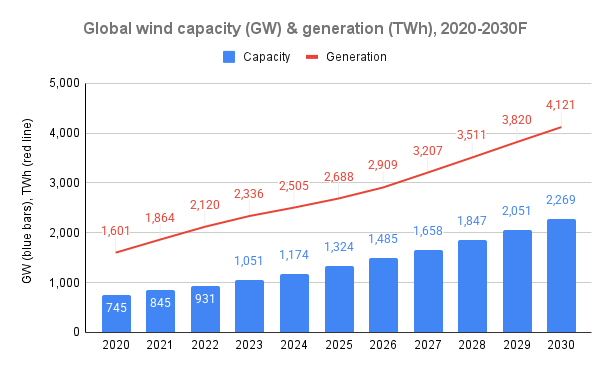
Historical data (2020-24; 2025 tbc): IEA, GWEC. Forecast 2026-30 data: Strome FOREST model.
Of the 6 main electricity generation sources, wind is currently about level with solar and nuclear, but still well behind coal, gas and hydro. By 2040, solar will be comfortably the leading global power source, but wind (green line below) will also overtake gas into second place, reaching 15% of global electricity generation. This assumes capacity growth moderates further to average 4.3%/pa over 2030-40. So there is scope for the outturn to be materially higher.

Global electricity generation by type, 2020-2040F. Historical data: IEA. Forecast data: Strome FOREST model.
Getting exposed to wind
If this long-term growth thesis turns out more or less correct, what might be the best way to play it? Key listed players come in two main categories:
Big developers such as Ørsted, RWE, Iberdrola, China Longyuan, NextEra, Brookfield Renewable Partners and EDP Renovaveis - some being more “pure-play” wind vs others being more diversified renewables utilities
Equipment manufacturers (OEMs) like Vestas, Nordex, GE, Ming Yang and Goldwind, leaders in a global wind supply chain that extends from all the component parts through to installation vessels
In simple terms, developers carry the risks and rewards of project delivery. To finance and build new projects, especially larger ones, they typically need government-backed long-term fixed-price arrangements like CfDs or power purchase agreements (PPAs) with large, creditworthy companies. OEMs compete to supply them while seeking to protect profit margins. Their business tends to be more cyclical in nature.
Chinese OEMs have come to dominate solar, battery and increasingly electric vehicle supply chains. Strong domestic market growth has enabled them to build unrivalled scale and cost efficiency. That in turn puts them in pole position to lead the rollout across emerging markets where most future demand growth will come. As China dominates wind capacity expansion, this may well happen in the wind sector, if in fact it hasn’t already. Chinese OEMs also enjoy the backing of Chinese financial institutions to offer compelling commercial propositions. At the same time, domestic competition can be fierce, as seen in solar and EVs.
European OEMs, meanwhile, will be more focused on protecting margins ahead of growth for growth’s sake. Instead of competing on cost, they seek differentiation as full-service providers, offering not just equipment but optimised systems, software and services for wind and hybrid wind-battery projects. No doubt AI will have a role to play here, in terms of predictive maintenance and maximising utilisation.
Comparative market performance
Major wind OEM share prices tell the story of the past 5 years: 2021-24 slump then a strong recovery over 2025-26 to date. Perhaps we should have got around to this edition a year ago…Some valuations have tripled - and if anything are now looking stretched again. Developers like Iberdrola, RWE and EDPR have also seen valuations grow by up to 50% over the past year, while smaller diversified players have done even better.
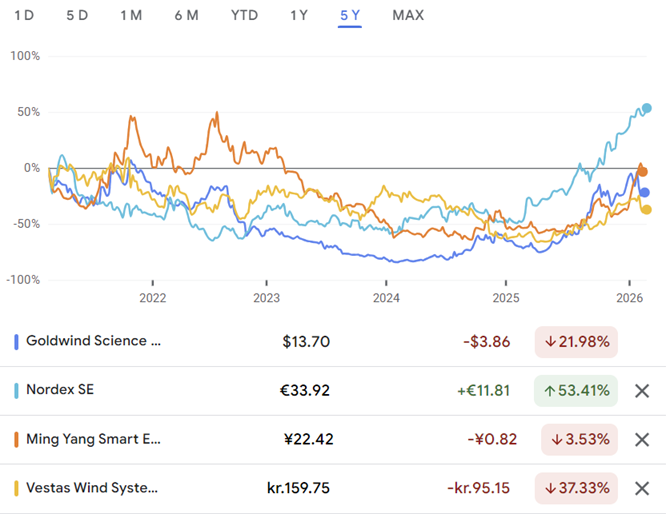
Simple share price comparison of selected wind OEMs: last 5 years, 19 Feb 2026
Nordex, the Hamburg-headquartered European OEM, has seen the strongest recovery of the manufacturers. Its share price has tripled over the year to early February 2026 and even after a recent pullback currently trades at a forward P/E ratio of 30x. Meanwhile, Vestas rose nearly 150% and even after recent weakness, has a forward P/E of 21x.
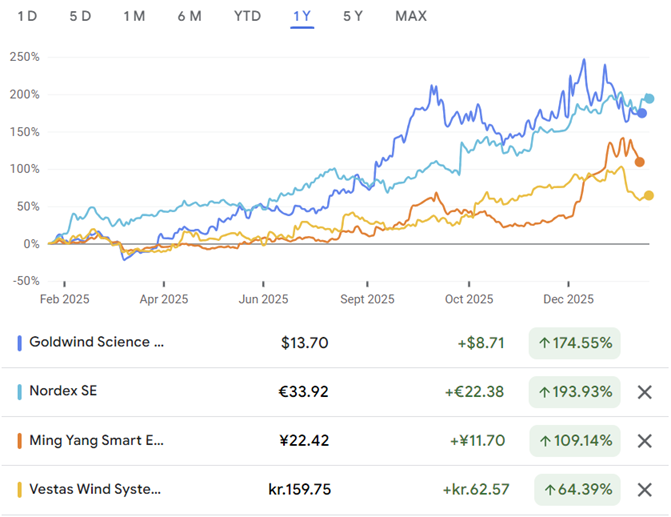
Share price comparison of selected wind OEMs: last 12 months, 19 Feb 2026
China’s Goldwind has returned to the $15-20/share range it last saw in 2021, from a low of just $4 in April 2025. It’s Hong Kong listed shares doubled in just over 4 months from September 2025, before also dipping, but has a much lower forward P/E of 11x.
Big wind developers like Iberdrola, RWE and EDPR have also recovered strong in the past year, albeit in steadier fashion. The outlier is Ørsted, which is not only a specialist wind developer, but now specifically a Europe-focused offshore wind specialist, after divesting its onshore business to Copenhagen Investment Partners.
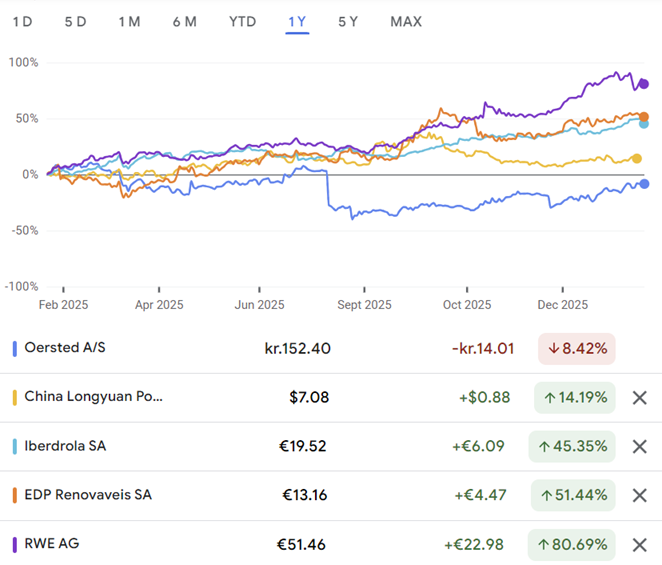
Share price comparison of selected wind/renewable developers/utilities: 1 year view, 19 Feb 2026
Over a five year view, Ørsted has also lagged the broader renewable developer market by some distance, and remains nearly 75% down over that period.
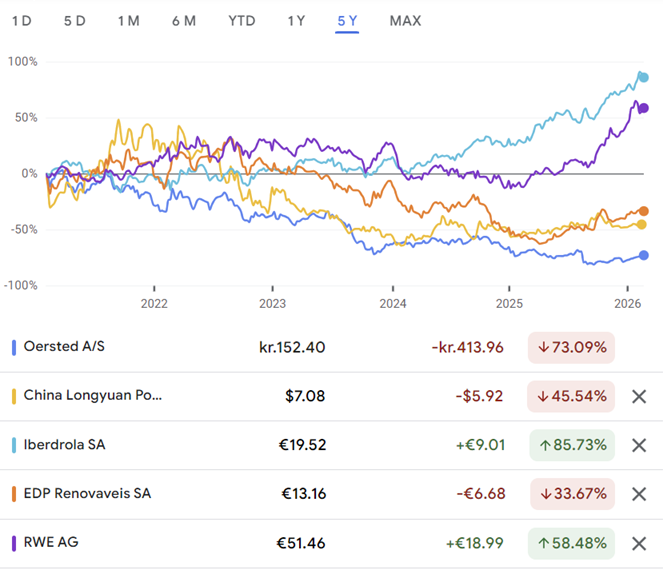
Share price comparison of selected wind/renewable developers/utilities: last 5 years, 19 Feb 2026
Ørsted: a risky play on Europe’s doubling down on wind?
There are plenty of reasons to be cautious about Ørsted. Its market performance reflects a litany of project execution challenges in recent years. Rising costs and delays put its business model under severe pressure and forced a change of leadership, cancellation of its dividend, a deeply discounted DKK 60 billion rights issue and several big divestments in order to stay alive. Its foray into the US market put it on an arbitration collision course with the Trump administration, catching it in the crossfire of his Greenland ambitions.
Ultimately, offshore wind is and always will be higher cost than onshore wind and of course solar. It remains vulnerable to inflation shocks. And it relies on the timely buildout of grid connections and interconnectors, creating project on project risks. And after share price recovery since August 2025, Ørsted now trades on a forward P/E ratio of 23x, hardly cheap compared to China Longyuan, for example, on just 7-8x.
Despite all these valid concerns, we can still see Ørsted’s long-term buildout of a more resilient offshore portfolio ultimately bringing further recovery in value, cash flow and even the resumption of dividend payouts. In January, we cautiously added it to the Energized Portfolio (more detail to come on the latter in future editions) for the following reasons:
Specialist focus: Ørsted not only offers distinct wind exposure, compared to other diversified renewables developers, but specifically offshore wind. Admittedly, that brings higher financing and development risks. But in Europe at least it also offers a path to greater scale, higher capacity factors and higher realised prices underwritten by governments via CfDs or large creditworthy offtakers via PPAs. Its decision to focus on European offshore wind may well not have been entirely voluntary. But strategic focus on leading in a core business can be better than trying to compete more broadly. This still leaves it with a substantial 8.1 GW development portfolio, including the 2.85 GW Hornsea 3 (UK), the 1.5 GW Baltica 2 (Poland) and 0.9 GW Borkum Riffgrund 3 (Germany).
European strategic goals: Equally, Ørsted likely has most to gain from the European vision of up to 15 GW/pa of new offshore projects out to 2040, supporting further growth of its long-term project pipeline. Ørsted has been semi-nationalised, with the Danish government now owning 50.1% and the Norwegian government also effectively a shareholder via the 10% strategic stake held by Equinor. That does not guarantee future valuation, but it does imply strong political support in leading the buildout of strategic European infrastructure.
Financial discipline: More scale only matters if it’s delivered profitably. Ørsted’s painful reset has strengthened its balance sheet. A renewed focus on financial returns and disciplined capital allocation was demonstrated by the May 2025 decision to defer the 2.4 GW Hornsea 4. To be more competitive, Ørsted is also targeting a 30% reduction in the price of electricity from offshore wind by 2040. That implies a leaner operating model with more ambitious internal cost targets.
Recovering trend: As the turnaround progresses, Ørsted’s worst seems to be finally behind it, both business and valuation wise. It returned to profitability in 2025 after two years of net losses. Its share price recovery has lagged peers, but is still reflecting this progress, trending steadily upwards to around DKK 150 since the low of DKK 100 August 2025.
The less risky option: wind ETFs
Rather than trying to pick one winner in wind, a less risky route to invest specifically in wind is via ETFs. These are also up 45-55% over the past 12 months, reflecting the widespread recovery across the sector. But they have the benefit of some diversification, including across developers and OEMs across different geographies. There are three main ones available:
First Trust Global Wind Energy ETF (FAN) - top 5 holdings: Vestas, Nordex, EDP Renovaveis, Englight, Orsted
Global X Wind Energy UCITS ETF (WNDG) - top 5 holdigs: Vestas, Orsted, China Three Gorges, EDP Renovaveis, Ming Yang Smart Energy
Invesco Wind ENergy UCITS ETF (WNDY) - top 5 holdings: Furukawa Electric, Enlight, Wasion, Energix, Daihen
Ongoing risks
Despite the prospect of long-term global capacity and output growth, wind developers and OEMs will continue to face a range of inherent risks that are not easy to mitigate. These include:
Macroeconomic: Interest rates appear to be well past their 2021-23 peak. But with sticky inflation, they may not fall much further either. Another inflation shock would push the cost of capital for large wind projects back up again.
Market: Electricity prices could fall to a point where new wind projects, particularly offshore ones, are not competitive enough to meet investment return hurdles. Although the real question is where wind’s all-in costs fall relative to other sources of new generation capacity for a given market.
Political: Governments could lose focus or fail to galvanise collective action. Russian gas returning meaningfully to Europe looks highly unlikely, but that could change. The US shows the risk of sharp reversals in government policy. The UK’s Reform party has threatened to cancel the CfD scheme, believing a US-style onshore shale gas revolution is the answer (despite no real evidence that it could work in the UK). However, reactionary voices are usually loudest in opposition and more pragmatic if they reach power. Indigenous energy endowments still need to be maximised, something which China and many other countries understand very well. The US’ abundant energy resources arguably allows it to indulge its leader’s energy blindness, but energy importing countries have a different calculus.
Regulatory: Establishing large-scale cross-border investment frameworks and CfDs in Europe will require negotiation and compromise, so positive outcomes are not guaranteed.
Technical: There are two risks here. First, either solar ends up being so efficient, cheap and quick to install that it effectively cannabalises wind’s future growth. Or second, that other technologies like advanced geothermal break through to outcompete new wind projects.
Systemic: Grid investment has lagged investment in generation capacity, creating severe connection backlogs. We expect this will rebalance as financial incentives evolve, but if not then wind’s scope for growth may be curtailed. That said, the battery storage revolution will help to alleviate grid congestion.
Notes:
*A Contract for Difference (CfD) in renewables is a typically government-backed mechanism whereby a fixed-price or price formula is agreed for the ouptput of a given project. When the market price is below that reference price, the buyer compensates the seller for the difference, and vice versa when it is above it, so that the output is sold effectively at the reference price over time. A merchant project is exposed to the risk of actual market prices, rather than having a fixed price arrangement in place like a CfD or a PPA.