


ENERGIZED: Investment Insights on Energy Transformation
Edition 21
The definitive energy shock: how this war accelerates global energy transformation
27 March 2026
Please note: This newsletter is for general informational purposes only and should not be construed as financial, legal or tax advice nor as an invitation or inducement to engage in any specific investment activity, nor to address the specific personal requirements of any readers.
Key Takeaways:
We are now one month into a war that has truly crossed the rubicon for the entire energy spectrum: oil, gas, power, coal, LPG, petrol, diesel, jet fuel, naphtha… Not to mention the impact on fertilisers and therefore food production.
Higher inflation and interest rates look inevitable, bringing real economic pain. Everything is connected. Nothing is immune.
The Strait of Hormuz will never be completely the same again. It is not closed; it is selectively closed. It is being turned into a toll booth.
This is already by far the largest supply shock in 170 years of oil industry history. So far, financial markets have underpriced the impact. But it can still get much worse. Boots on the ground were initially unthinkable – now the speculation turns towards a military takeover of Iran’s oil export terminal, Kharg Island.
Whatever happens next, demand destruction is already guaranteed across key energy commodities, both short-term and, more importantly, longer-term. That means much higher prices still.
This changes everything. Times like this remind us of the energy industry’s oldest adage: the stone age did not end because they ran out of stones. We have seen this movie before, but the remake ends differently to the 1973, 1979 and 2022 versions. The difference: electrification, renewables, batteries and energy efficiencies are now genuinely competitive.
Jeff Currie rightly reminds us that “you can’t print molecules”. Equally, we are fast moving into a world where you can (effectively) print electrons. Solar, battery and EV manufacturers are already 3D printing the future of global energy infrastructure.
As a strong catalyst for systemic change, this war therefore underpins the long-term prospects for energy transformation companies, as they tackle the challenge of replacing fossil fuel dependence at much greater scale
Clean energy equities have mainly lagged fossil equities over the past month due to commodity price spikes, but are significantly ahead over a 1-year view (+60% vs +15%) - continued long-term outperformance is now more likely
The war presents a terminal risk to LNG market growth and therefore the wider global gas market. Expensive LNG simply will not be competitive with price-sensitive Asian buyers.
Sharply higher oil prices pull peak oil demand further forward, most likely to 2027. This reinforces the pendulum swing to electrified mobility. Oil displacement will reach 5.5 mbd by 2030 and exceed 11 mbd by 2035.
The ratio of clean to fossil energy investment is likely to increase from 2:1 in 2025 to 4:1 by 2030 and 7:1 by 2035
We also see grid investment reaching parity with total fossil investment by 2030-31 at ~$800 bn/pa
March 2026: the month that changed everything
This war is one month old today. It lacked a clear strategy from the start. Entirely predictably, instead of instigating regime change, it has had the opposite effect inside Iran.
It will eventually end, perhaps abruptly, and hopefully quickly. If not, the IEA warns of the worst energy crisis in history.
But even if so, its energy legacy is already written. It will be this decade’s biggest catalyst for energy transformation - bigger even than 2022.
Make no mistake: while the world is glued to commodity markets and the Strait of Hormuz, that transformation is accelerating.
The escalation trap
Trump’s hopes of a quick, early knockout victory and rapid normalisation of commodity markets have been dashed. Instead, Iran has dragged its adversaries via Hormuz into a heavyweight contest that is set to go the distance. This was never meant to happen. Hormuz closure was always an extreme scenario for energy analysts. It always seemed like a lose-lose scenario - and therefore highly unlikely. That assessment has been proven totally wrong. The Black Swan has landed.
Tactics have overridden strategy. Negotiated compromise is almost impossible when senior interlocutors, like Ali Larijani, are assassinated. The escalation cycle threatens to spiral out of control.
A key inflection point came on 18 March when Israel, allegedly unilaterally, attacked Iran’s South Pars field. The northern end of Qatar’s North Field, this is the largest and most important accumulation of gas in the world, measuring about the size of Qatar itself.
Until then, mutual interests dictated that major production facilities were off limits. But this direct targeting of a critical energy installation crossed the rubicon into a much deeper, longer market disruption.
This brought all regional energy infrastructure into play. Among other targets in Saudi Arabia and UAE, Iran’s swift and inevitable retaliation targeted Qatar’s Ras Laffan gas liquefaction complex. This is world’s (biggest?) LNG export terminal with a pivotal role in global energy trade, exporting North Field gas across Asian markets.
Dragging South Pars / North Field into the conflict is a dangerous turning point for the global gas industry. But the overall impact on the oil market will be greater still. Global hydrocarbon energy system growth is literally going up in flames.
The escalation cycle now threatens Iran’s power system, just as Russia has targeted Ukraine’s. That in turn would inevitably bring retaliation against other power generation and/or desalination assets across the Gulf, triggering an even deeper crisis.
Short-term energy market impact
Escalation into direct attacks on permanent energy installations, not just energy shipping, turns a temporary spike in oil and gas prices into a much higher for longer outcome. The IEA has counted at least 40 regional energy facilities that have “severely or very severely” damaged.
That affects not only oil, gas, petrol, diesel and aviation fuel, but spreads directly into power markets too. Plus other key inputs like fertilisers for food and naphtha for petrochemicals. Prices will remain higher than pre-war across the board. This shock to the whole energy spectrum threatens an inflation crisis that can spread across markets to trigger a wider global downturn or even the next financial meltdown.
The numbers show how serious this is: the 1973 and 1979 oil crises took 5 mbd (~9% of supply) out of the market. The 2022 gas crisis took out 75 BCM. This crisis threatens to take out 11 mbd (~11% of supply) and 140 BCM/year. But for how long? Markets are starting to realise that it could be much longer than initially assumed.
Asian economies are nominally the most directly exposed to interruption of Gulf oil and gas exports. But of course, for globally-traded commodities, a supply disruption anywhere leads to a price shock everywhere. No matter how much a particular country produces, consumes, exports or imports. No one is insulated. Everything is connected.
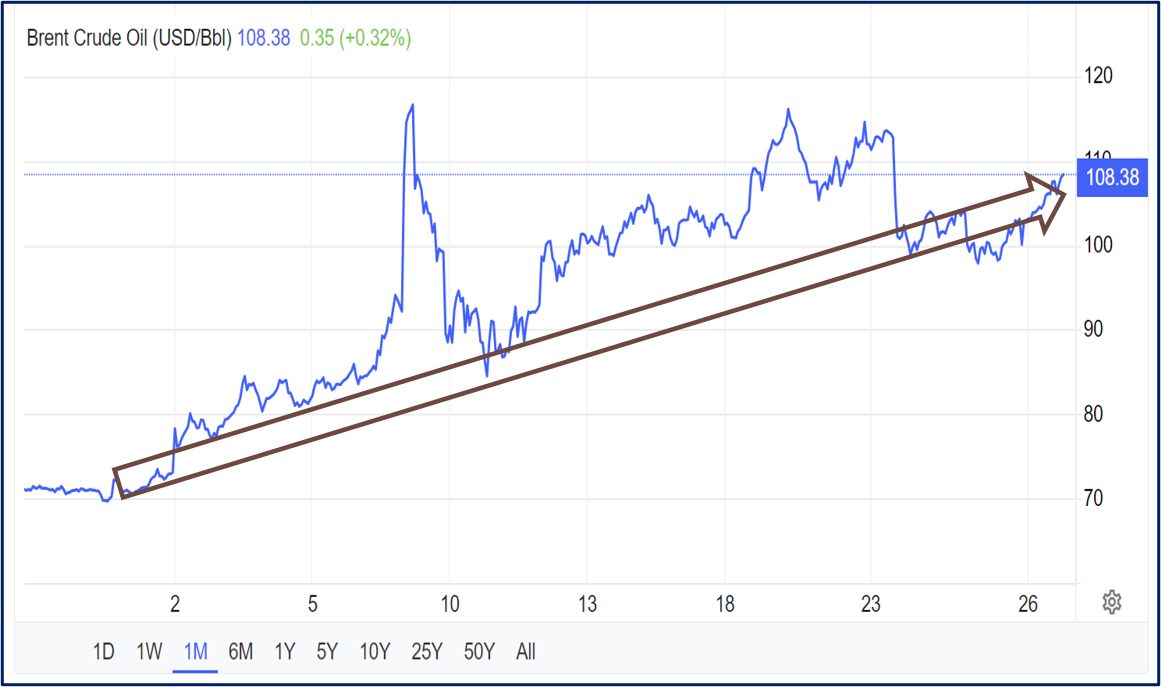
Brent crude oil front-month futures over the 1 month of war to date. Source Trading Economics, 26 March 2026
Markets have struggled to process this war’s wildly conflicting signals. Oil and gas prices have whipsawed, as Trump tries to talk them back down after each escalation.
While Hormuz remains closed to cargoes serving countries deemed hostile to Iran, the clear trend is upward. The longer that lasts, the higher these markets will go. The more damage to energy infrastructure, the longer they will stay high. There is a rapidly increasing risk of unprecedented price levels for oil and many other commodities.
If and when Hormuz eventually fully reopens, which could yet be a painfully long time away, commodity markets will also continue to price in far more geopolitical risk than before. The increasingly likely survival of the Iranian regime, Israel’s implacable enemy, maintains the risk of future wars.
Even if the war ends tomorrow, it could easily take up to a year or two for oil, gas and derivative product markets to fully “normalise”, i.e. for ample supply and prices around pre-war levels of $60-65/bbl (Brent) / €30-35/MWh (TTF) to return.
Implications for gas
This crisis presents a very serious threat to the LNG industry in particular. Qatar is its cornerstone, but its absolute vulnerability has been brutally exposed. Hostage to a clash of ideologies totally beyond its control, it is now indefinitely out of action.
The sudden disappearance of Qatari cargoes means immediate LNG demand destruction. That foreshadows what is to come: a temporary blip becomes permanent. Replacing those liquefaction trains costs billions and takes up to 5 years. But by then, the LNG demand they served will likely have already been substituted, never to return.
LNG is a relatively expensive energy source. Its key Asian markets are increasingly price sensitive. Even before the war, its growth prospects were questionable. In fact, S&P Global data suggest that net imports of LNG into Asia have not grown over the last four years. In particular, Chinese LNG imports were 16% down over that period. The direction of travel for the world’s largest LNG importer is pointing clearly down.
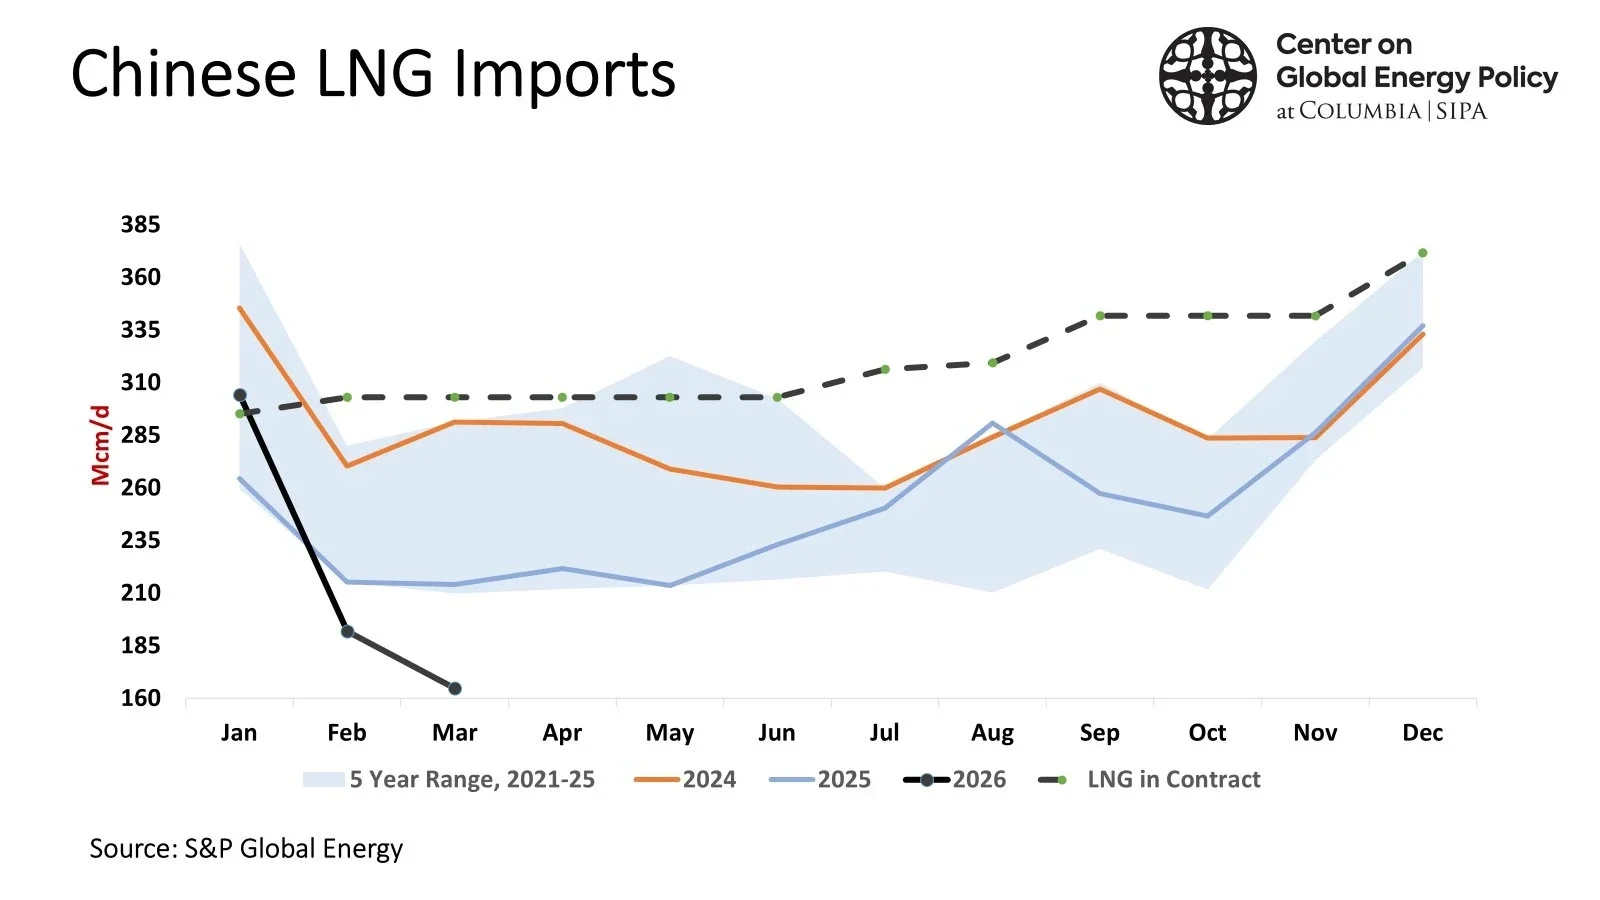
Chinese LNG imports 2024-2026 YTD. Source: S&P Global Energy
The doubling of international gas prices, even if it proves temporary, significantly increases the substitution dynamic. Depending on the market and the application, there is a wide spectrum of alternative options, from solar, wind, coal, nuclear, other clean generation, batteries, plus demand destruction and energy efficiency measures.
Solar and batteries stand out because are already far cheaper than they were even in the last major energy crisis, just four years ago in 2022. The International Renewable Energy Agency notes that by 2024, over 90% of renewable power projects were already cheaper than fossil-based alternatives. Much higher gas prices make this effectively 100%.
The 2022 gas crisis forced European energy importing nations to switch away from Russian gas supply. Shorter-term, the path of least resistance was increased reliance on LNG, mainly from the US. In fairness, some progress has also been made in building out renewable power generation and battery storage capacity: 40% of EU power now comes from renewables, versus 25% before the invasion of Ukraine. There is still a long way to go, particularly in electrifying demand, even if European gas demand remains in structural decline since then. But the current crisis is a stark reminder that simply diversifying fossil fuel imports does not fundamentally solve the import dependence problem. For energy importing Europe, it strongly reinforces the learnings of 2022: the need to switch away from gas reliance altogether.
Oil demand displacement is accelerating
The oil market impact is likely to be even more stark. Electrified transport was already having a major impact. Factoring in everything from bikes to cars to buses to trucks, total displacement already reached 2.3 mbd in 2025, million barrels per day (mbd) in 2025 - a very material number at the margin of global oil markets. Even if it ended today, this war will undoubtedly accelerate this trend.
The front-month Brent oil futures contract, the leading international oil price benchmark, has consolidated above $100 and is heading higher. This trend highlights the permanent vulnerability to supply disruptions. As inventories run down, absent a breakthrough on Hormuz, prices will keep ticking up, despite Trump’s attempts to talk it down.
Less reliance on imported oil and gas is clearly critical. As the biggest buyer of Venezuelan and Iranian oil, China now has the strongest possible signal to further accelerate its nationwide electrification, renewables and battery infrastructure rollout. This is one part of a much broader, long-term, disciplined national energy security strategy, including:
Build up strategic oil reserves as far as possible in times of lower prices, to mitigate the effects of supply shocks like this one
Reduce the need for LNG imports, both via both alternative supply and demand reduction measures
Electrify the economy as widely and quickly as possible
Continued build-out of all types of power capacity: notably solar and wind, but also coal, hydro, nuclear
Connect major clean power projects to cities via extensive high-voltage (HVDC) and ultra high-voltage (UHVDC) transmission links
Expand grid-scale, commercial and residential stationary battery storage to save and use power more effectively
Other countries are increasingly likely to follow this broad template, based on their own national energy endowments. These measures are the only rational ways to hedge long-term commodity price risks. At current prices, Pakistan’s solar boom has been calculated to save it over $7 billion in LNG imports this year alone.
Pre-war, the International Energy Agency (IEA) expected 5.4 mbd of oil displacement by 2030. If anything, the risk is now to the upside. We expect at least 5.5 mbd displacement by 2030 and over 11 mbd by 2035.
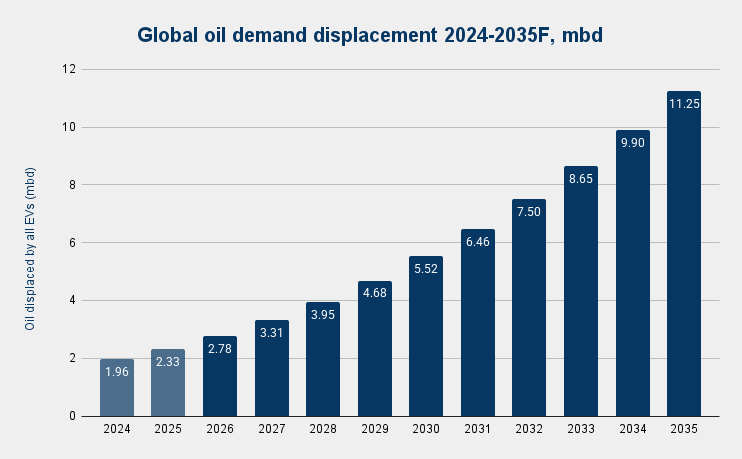
Global oil demand displacement 2024-2035F, mbd. Source: Strome FOREST model. Historical data: Bloomberg
Electric vehicles (EVs) were already fast becoming the rational economic choice across both developed and emerging markets. As battery energy density rises and costs continue to decline, range is increasing and cost per mile is rapidly falling. Not to mention the maintenance benefits, ease of driving and expanding charging infrastructure (although arguably less of an issue as range increases).
These factors are pushing EVs through adoption tipping points in several markets, but most notably China, where the cost of ownership now naturally favours them. Throw in the near doubling of oil prices during this war and the switching incentives become overwhelming. Early indications suggest EV adoption rates are already getting another major boost across global markets.
Chinese EV manufacturers are rapidly expanding both their exports and overseas manufacturing capacity to supply this surge. BYD’s latest Blade 2.0 EV battery shows just how fast the EV space is moving. With a 621 mile range, it can charge at 1.5 MW in just over 5 minutes (or 2km per second). Its 5,000 cycle rating gives it a mindboggling 745,000 mile lifespan - effectively an infinite car life. Traditional ICE vehicles will struggle to compete with the next generation of EVs.
Peak oil just got even closer
This in turn pulls forward peak oil demand - a watershed moment for the global energy system. Our base case now sees global oil demand peaking at around 104.4 million barrels per day (mbd) in 2027, before edging down slightly to 102.8 mbd by the end of 2030. As electrified transport takes off, the decline will then accelerate to just under 89 mbd by 2035.
Beyond that it clearly becomes far harder to predict, but compounding effects make ~65 mbd by 2040 actually quite plausible. That means over a third of the total oil market could disappear over the next 15 years. If you think in straight lines with a rear-view cognitive bias, this sounds absurd. But when you visualise the non-linear cumulative impact of transport electrification, it starts to make sense. More demand is lost over the half-decade of 2036-40 than the decade of 2026-2035.
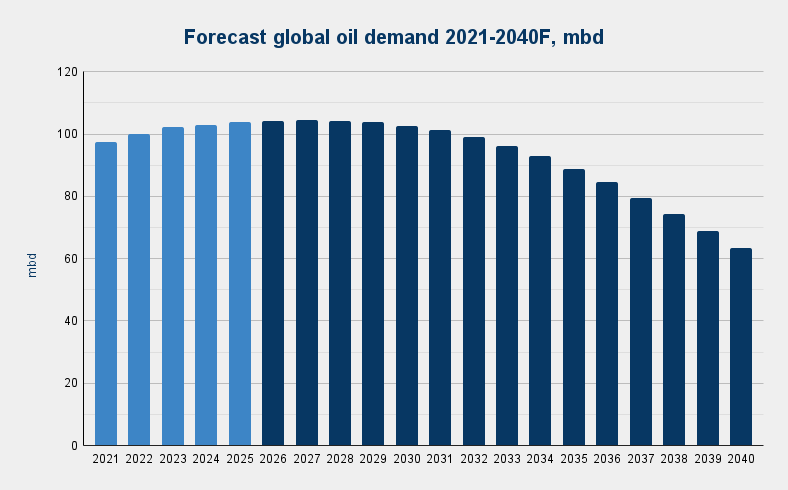
Forecast total global oil demand to 2040. Forecast: Strome FOREST model. Historical data: IEA.
Structural decline in the oil market will be unprecedented not just in our lifetimes, but in its full 170 year history. What are the implications?
It will suppress the prices of crude oils and their derivative products (petrol, diesel, etc), thereby reducing the incentives to invest in new production and refining capacity. Oil exporting countries will face increasing budget challenges unless they can find rapid ways to diversify. Oil companies will struggle to sustain valuations. Their shift away from re-investment of cash flows and towards shareholder payouts, already clearly visible, will accelerate.
Oil won’t disappear of course, but its importance in the global economic system will inexorably fade through the 2030s. Its share of primary energy peaked as far as as the 1973 oil embargo.
Same same but different
We have seen this energy shock movie before: most notably in 1973, 1979 and 2022. These spikes are a feature, not a bug, of the legacy system. As the think tank Ember puts it: “Fossil fuel volatility is structural, not episodic.”
Except this remake has a different ending. This time, the winners are the manufacturers and developers of the energy transformation, not just other oil and gas producers. The solution is a combination of deep electrification, clean generation infrastructure and storage capacity.
The key difference to those previous energy shocks is the maturity and affordability of these alternatives. In just four years from 2022 to 2025, solar PV panel prices have fallen by nearly half, from $0.36/W to $0.20W. That follows much greater declines. In 2007, they were over $5/W; in 1992, over $10/W, and in 1975, over $100/W. Similarly, lithium-ion battery cell prices fell from $128.72/kWh in 2022 to $60.60/kWh. Battery pack prices have fallen from $120/kWh to $81/kWh. Such price declines are now too compelling to ignore, not to mention their own advantages of installation speed and operating efficiency.
Gas-dependent markets like the UK are far more exposed to others that have scaled up local clean power generation, such as Spain (with plenty of solar, wind, hydro) or the Norway (mainly hydro). The UK is on the way there too, with wind as the backbone.
In whichever form, renewables firmed up by co-located batteries are steadily eroding the role of gas as marginal power generator, price setter and flexibility provider. Price shocks drive substitution, which will ultimately bring gas prices back down again, and power prices with them, even as they decouple.
The second best time to plant a tree is now
Previous crises drove similar incentives to increase investment in alternative energy sources. But each time, the economic conditions for a new energy order were still not in place, so the old order prevailed.
This time around, stronger incentives than ever meet far more competitive solutions. If governments, companies and individual consumers weren’t already convinced, now it will be pedal to the floor on energy transformation. That means more investment across all four key themes: renewables, electrification, battery flexibility and energy efficiency.
There will be a renewed focus on policy incentives and removing administrative delays. For example, UK government has just released its new future homes standard, ensuring that all new houses will have electric heating and solar panels as of 2028.
One headwind is that as he energy shock drives inflation and higher interest rates, the capital costs of clean energy deployment. Offsetting this, however, are fundamentally lower prices for much (albeit not all) of the hardware.
What we are witnessing in the Middle East is one key chapter in the noisy interregnum between two fundamental energy orders. In the narrow-lens context of our lives, the paradigm shift plays out over what seems quite a long time. But In the wider-lens context of 2-3 centuries of hydrocarbon system growth, the pace of change is in fact very rapid indeed.
As its forces work in non-linear fashion, energy transformation is going from barely perceptible to unmistakable signal. By the end of this decade, its momentum will be even more overwhelming.
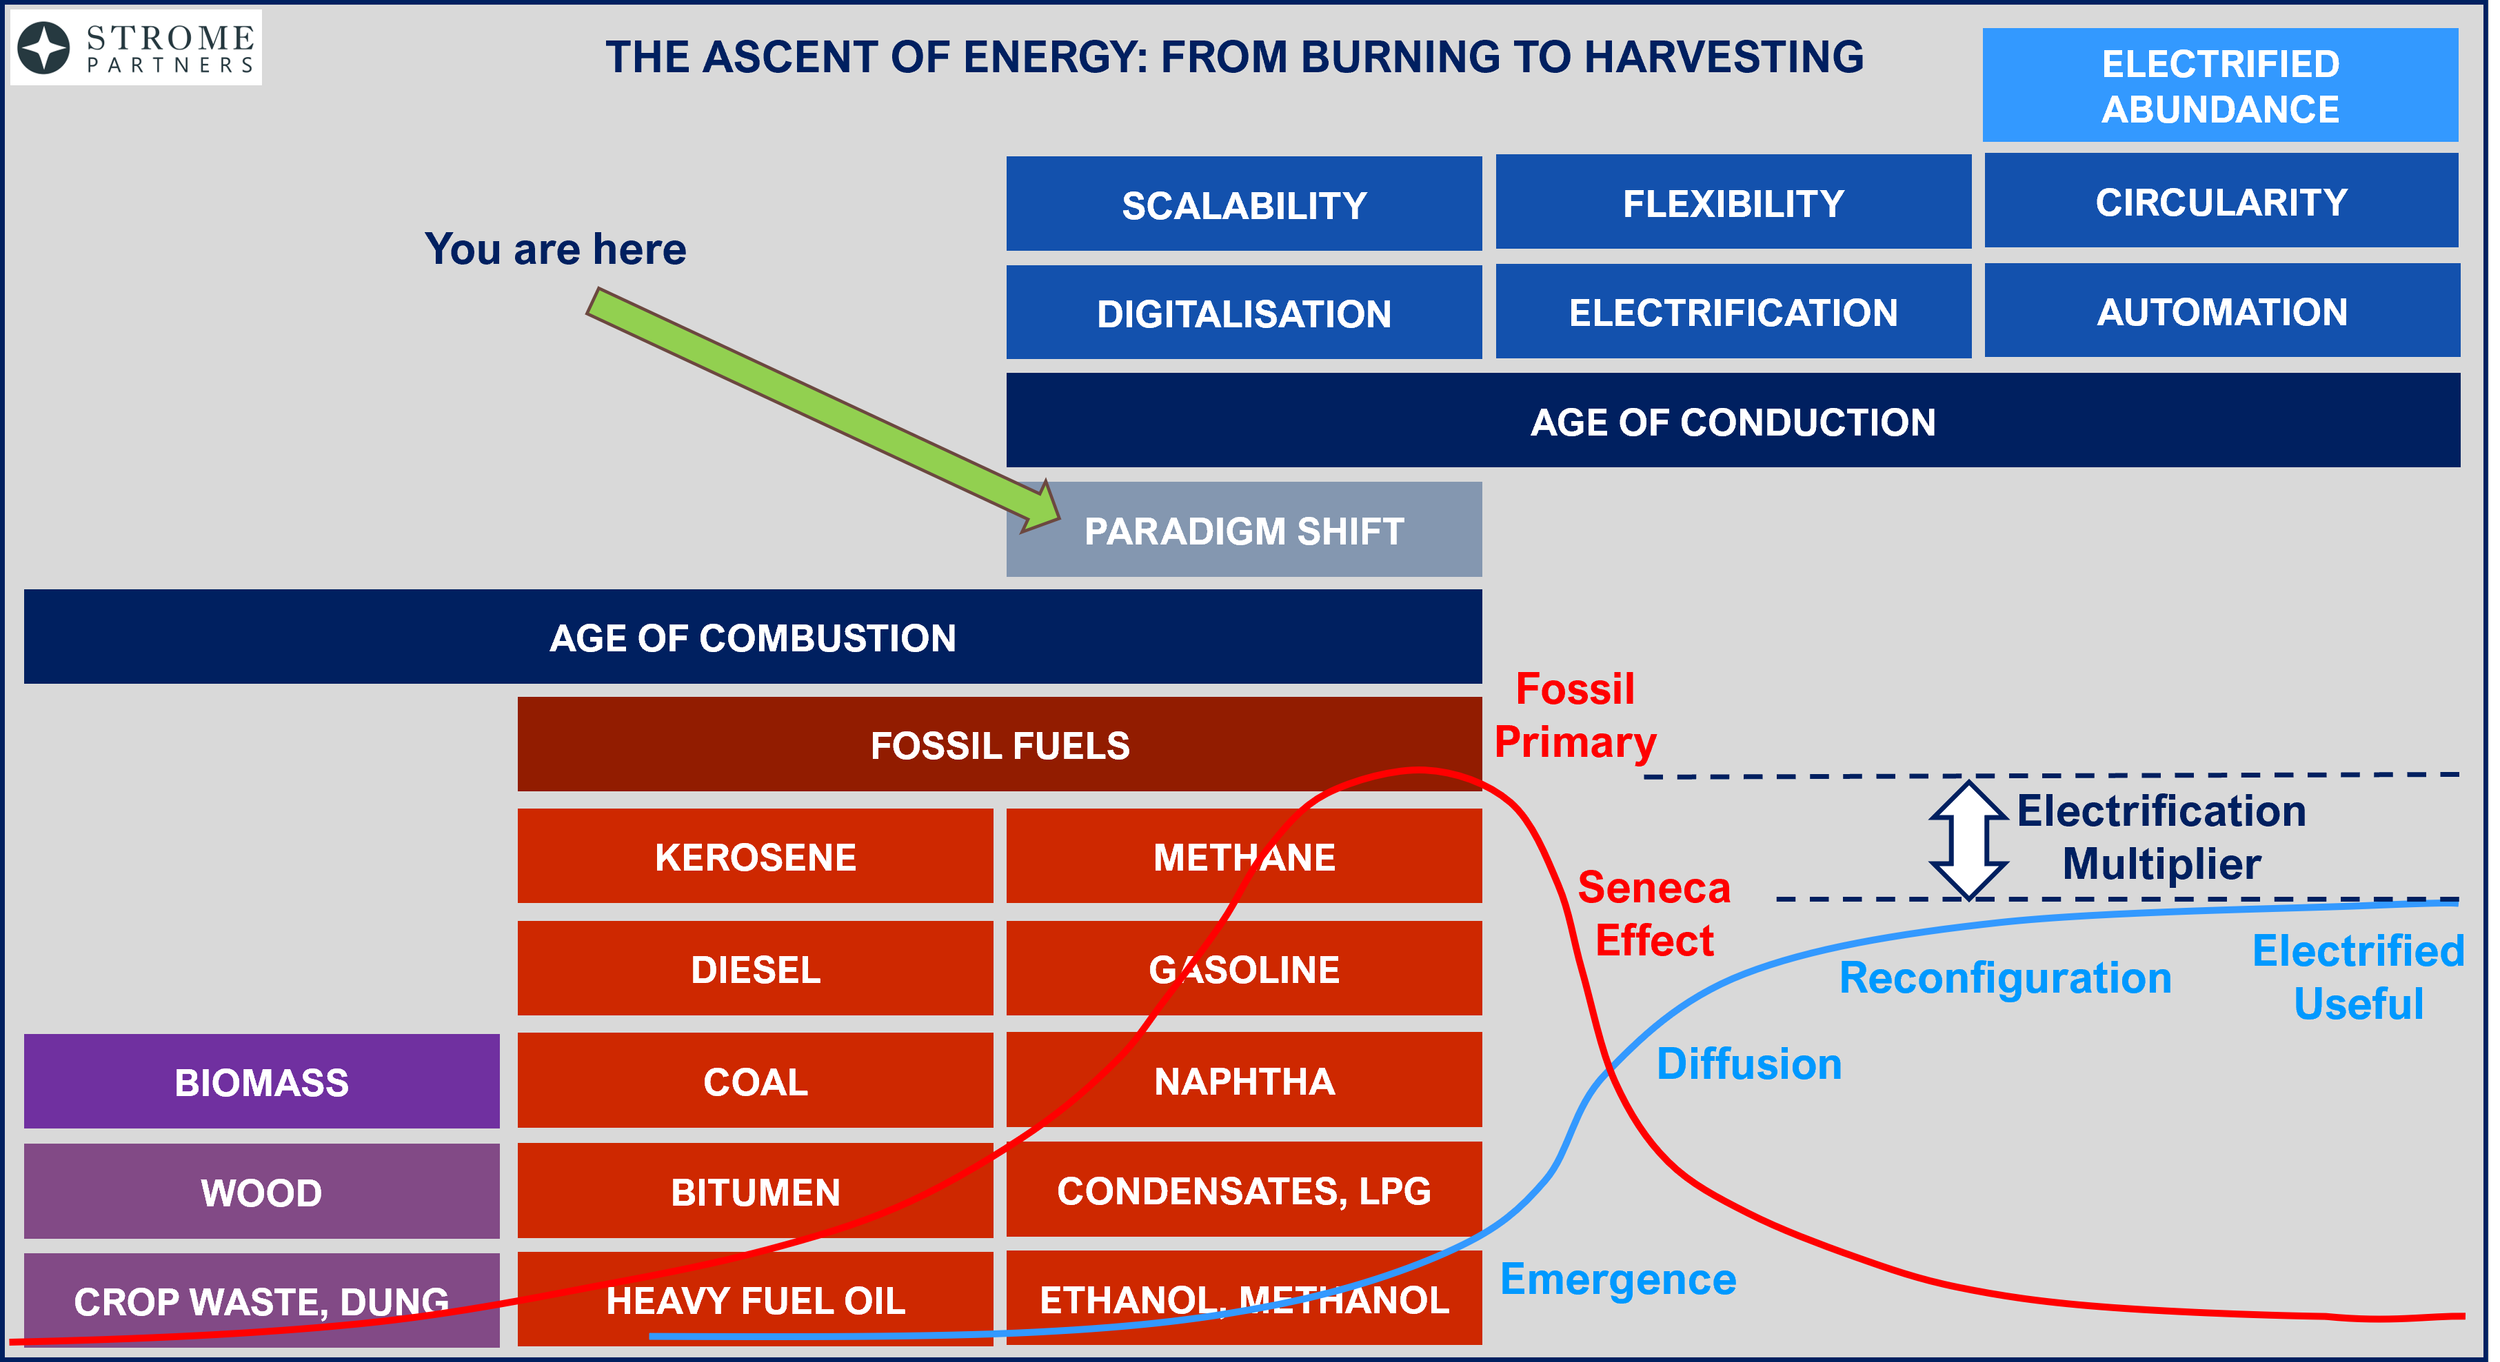
The Ascent of Energy: From Burning Biomass to Harvesting Electrified Abundance. Source: Strome
This interregnum takes us into a very different energy economy in the 2030s: where demand for all hydrocarbon sources is in structural decline. As the world benefits from ever-higher levels of installed clean infrastructure capacity, average energy costs will fall.
Follow the money
What will the investment flows to get there look like?
Over the first half of this decade, the ratio of clean energy to fossil energy investment rose from 1.3:1 to just under 2:1. “Clean energy” here is defined by the IEA to include grids, renewable power, nuclear, low-emission fuels and “energy efficiency and end-use”, i.e. electrification of industry, transport and buildings, while fossil energy includes coal, oil and gas.
The ~50% change in this ratio over those 5 years is the surest proof that energy transformation is already accelerating. These investment flows show us the future shape of global energy infrastructure.
Even pre-war, we expected this clean:fossil ratio to reach 4:1 by the end of this decade, based on granular growth rate assumptions for each sub-sector. Now it is far more likely.
Put another way, by 2030, 80% of energy investment will be clean, with only 20% in fossil fuels. Beyond that, we expect the ratio to reach 7:1 by 2035. Over that period, total energy investment increases from $3.3 trillion in 2025 to $5.0 trillion in 2035.
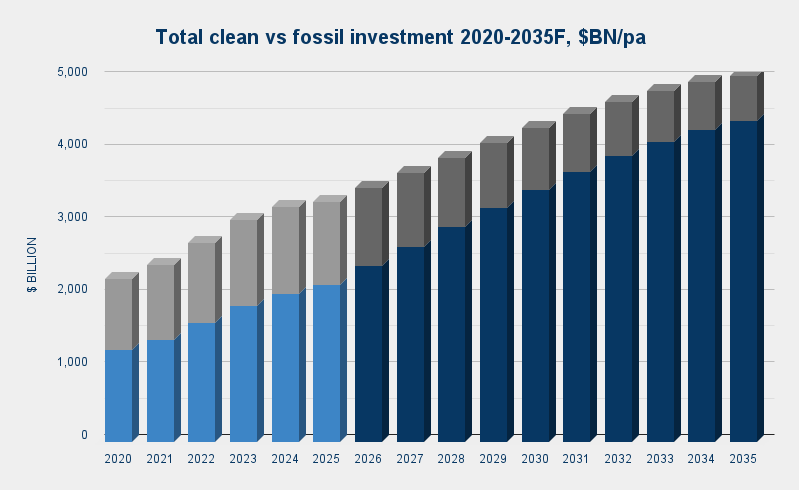
Total clean vs fossil investment 2021-2035F, $bn/pa. From 2:1 in 2025 to 4:1 by 2030 and 7:1 by 2035. Source: Strome FOREST model
In fact, our base case sees global grid investment reaching parity with total fossil investment at around $800bn/pa by 2030-31.
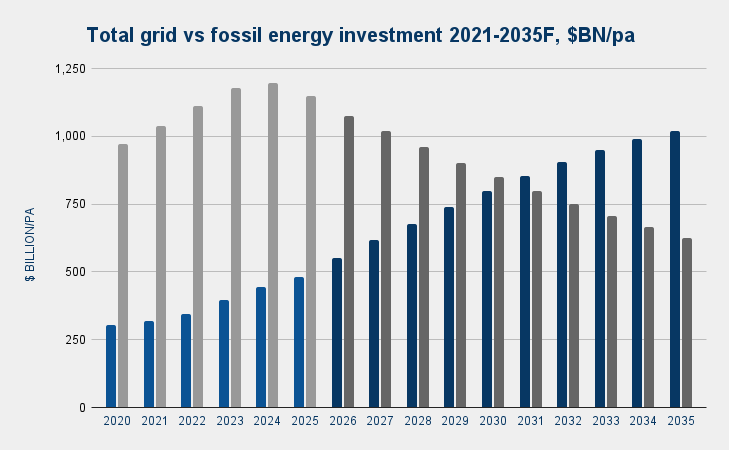
Total grid vs fossil investment 2021-2035F, $bn/pa. Source: Strome FOREST model
Meanwhile, this next decade of accelerating investment means clean power generation rises from around 40% of total generation today to 63% by 2035.
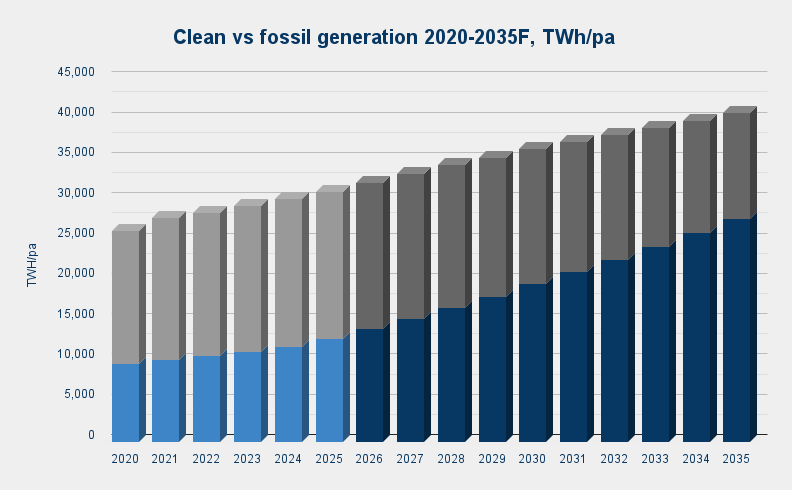
Total clean vs fossil generation 2020-2035F, TWh/pa. Source: Strome FOREST model
Energy is the fundamental capital
Financial crises typically lead to money creation and therefore inflation. Like gold, hydrocarbon supply cannot be similarly manipulated. As the veteran commodity analyst Jeff Currie recently put it: “You can’t print molecules.”
That is absolutely true. But there is another angle. We are also entering a world where you can (effectively) print electrons.
The Chinese Buddhist woodblock Diamond Sutra is reputedly the world's earliest known printed book, dating back to 868 CE. The invention of printing was a profound technological shift, enabling the rapid expansion and sharing of knowledge.

The Diamond Sutra: reputedly the oldest printed book in the world. Source: The Collector
Over a millennium later, the same country is driving a new printing revolution: the 3D printing of electricity generation and electric mobility.
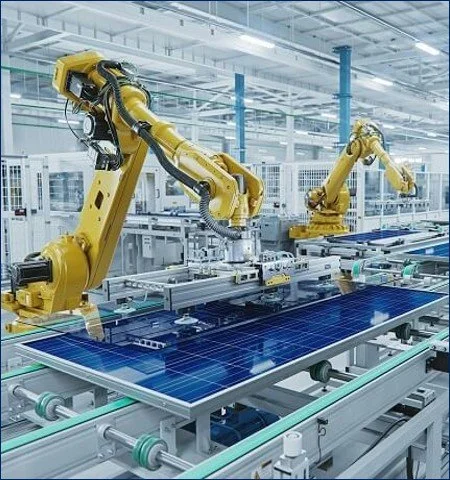
Solar panel manufacturing
In 2025, another 650 GW (0.65 TW) of new solar panels were installed around the world. Total installed capacity is now around 3 TW. We expect it to hit 6.5 TW by 2030 and over 11 TW by 2035.
Every single 450W solar panel harnesses, depending on location, 10-20 MWh over its decades of useful life, from an effectively infinite free resource. No moving parts, no need to refuel. Besides grid-scale and rooftop solar, we are also in the very early stages of growth in “balcony” or “plug-in” solar, where consumers install it in ever more creative locations. The barriers to adoption keep on falling.
Unstoppable momentum
From almost zero as recently as 2015, total solar output rose by around 30% last year to nearly 2,700 TWh - nearly 10% of global electricity generation. That may not sound like so much. But it’s not the stock that matters so much as the flow over time. Even as installation growth rates slow down, solar is on track to become the world’s single largest power source by 2032, with a 22% share of generation. It will then pull well ahead of all other sources - notably coal, gas, wind, hydro and nuclear - reaching a 38% share.
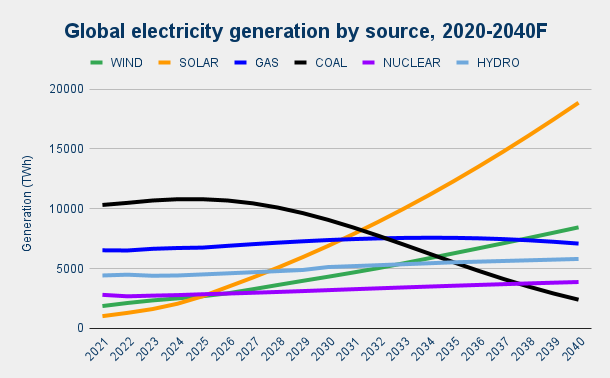
Global electricity generation by source, 2020-2040F. Source: Strome FOREST model. Historical data: IEA.
Equally significant is the parallel 3D printing revolution in energy storage, in the form of lithium-ion batteries. That revolution is still really just getting started and will change the game for energy. Being at an earlier phase of the adoption curve, current growth rates are even faster even than for solar.
Then it is the combination of these manufactured energy infrastructures where the magic will really happen. It opens up a future of firm, around-the-clock clean power. Local, reliable and affordable. Especially in the high irradiation sunbelt where around 80% of the world's population live.
Both solar PV and lithium-ion battery manufacturing are currently in substantial overcapacity, thanks to Chinese industrial policy prioritising rapid scaling over profitability. That will enable continued abundant supply and price deflation, both of the products themselves and the power they produce and store. This is already visible in low or negative prices during daytime peaks across many markets.
Then we have the Jevons effect: as things get cheaper, more efficient and more plentiful, we humans find new ways to use them, meaning our total demand rises. As things get cheaper, more efficient and more plentiful, we humans find new ways to use them, meaning our total demand rises. This has been observed from basic commodities like coal through the advent of electric lighting and refrigeration to mobile phone adoption.
It will be no different when abundant supply ultimately makes electricity cheaper everywhere - and in many times and places free or even negatively priced (i.e. where you get paid to use it). This will inevitably accelerate electrification - not just across transport, but heating, cooling and many industrial processes. New demand sources are emerging - AI, robots, autonomous vehicles - consuming electricity rather than molecules. As this gathers pace, fossil energies get cascaded out of the system, leaving behind the era when “clean energies are only additive”.
Energy investment takeaways
From an investment perspective, this is a clear catalyst for the electrification and clean energy technology supercycle, which had already taken off in equity markets last year.
Is there any early evidence of a new shift in investor sentiment? Clearly, we should be cautious about drawing any big conclusions from just one month of market data. The share price of the world’s leading battery manufacturer, CATL, did jump from around 500 HKD to 700 HKD over a week in early March. Other energy transformation names like Geely, CALB and BYD saw similar rises. However, this is probably just coincidental. Out of the ~150 energy transformation stocks, ETFs and indices that we track, these were the exceptions rather than the rule.
To nobody’s surprise, the more notable valuation boost so far has in fact been for oil and gas producers. The catalyst for energy transformation companies will likely be priced in more gradually. We may have a better perspective in a few months. For now, the fact remains that clean energy equity indices have strongly outperformed wider markets over the past year, after 4 years of heavy underperformance.
The simplistic comparison below between the S&P Global Clean Energy Index versus the S&P 500 over those periods clearly illustrates this. This latest energy shock only strengthens the case for this strong clean energy recovery to evolve into a steady longer-term growth cycle.
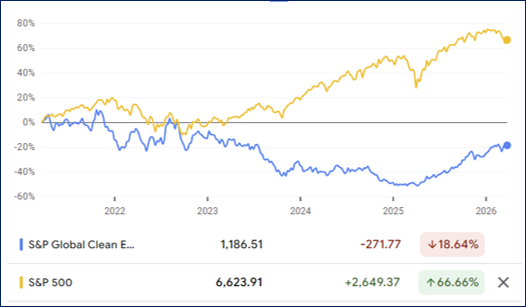
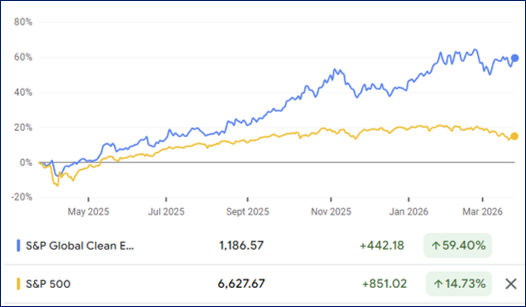
S&P Global Clean Energy index vs S&P 500 index, 5-year vs 1-year views, 26 March 2026. Source: Google Finance