


ENERGIZED: Investment Insights on Energy Transformation
Edition 23
Follow the money: the next decade of global energy investment
15 July 2026
Today’s financial flows reveal tomorrow’s reality
Every day, the headlines remind us what a pivotal period in energy and geopolitics we’re living through. But the Pandora’s Box that has been opened at the Strait of Hormuz is just one symptom of the deeper inflection underway across global energy investment.
To understand our energy future, we look not so much as today’s stock of assets but at the changes in capital flows into the system. To invest in energy effectively, we need to understand the past, present and future changes in these flows. As they say: follow the money.
The investment shifts of the past decade help to inform on what the next decade might bring, enabling focus on suitable capital allocation themes in which to identify long-term opportunities. This International Energy Agency (IEA) graphic summarises the cumulative changes across global energy investment since 2015:
Please note: This newsletter is for general informational purposes only and should not be construed as financial, legal or tax advice nor as an invitation or inducement to engage in any specific investment activity, nor to address the specific personal requirements of any readers.
Read the presentation version of this edition
Key Takeaways:
To understand the evolution of global energy, we first look at changes in energy investment. The global clean/fossil energy investment ratio is evolving through three distinct phases:
Equalisation: 2015-2020 (reaching 1:1)
Divergence: 2021-2025 (approaching 2:1)
Transformation: 2026-2035E (reaching 4:1)
We are passing through an inflection point where clean energy investment increasingly self-reinforces in a positive feedback loop, compounding the shift to an electrified system. As per Hemingway’s Bankruptcy Rule, that shift initially appears slow, then suddenly much faster.
As global oil and coal demand plateau, from 2028 all projected net growth in energy investment will be clean
But the shift is not just from fossil to clean, it is increasingly also from renewables to electrification and flexibility, reflecting shifting bottlenecks in the system
Over 2015-25, global energy investment grew at a 2.1% compound annual growth rate (CAGR): end use electrification (+9.0%) and renewables (+7.9%) gained the biggest relative shares, while oil (-9.4%) and gas (-3.1%) both lost share
Over 2025-35, we see global energy investment growing at a 4.8% CAGR, with electrification (+7.6%), grids (+6.9%) and battery storage (+6.3%) gaining most share, while oil (-7.8%), gas (-5.9%), coal (-3.7%), efficiency (-2.7%) and renewables (-0.6%) all lose share
These three megatrends reshape global energy systems over 2025-35, making them the core themes of a robust long-term energy investment portfolio:
You can’t run tomorrow’s system on yesterday’s grids: grid investment more than doubles from $448bn/pa in 2025 to $1.1tn/pa by 2035 (in real 2025 USD terms), at a 9.0% CAGR, reflecting the universal need for new transmission, interconnection, distribution and associated critical infrastructure
Electrification is a strategic imperative: investment nearly triples from $400bn/pa to $1.1bn/pa by 2035, at a 10.3% CAGR, reflecting its deep economic, energy security and environmental benefits
The battery revolution is just getting started: battery storage investment grows the fastest, rising ~7x from $78bn/pa to $519bn/pa by 2035, at a 19.9% CAGR (vs 55% over the past decade), translating into ~15x growth in actual battery capacity in GWh terms as costs decline and durations extend
This makes intuitive sense as the other key system elements race to catch up with maturing renewables investment, which continues at a steadier 4.5% CAGR from $690bn/pa to just over $1tn/pa by 2035, thereby losing overall share
Overall, clean energy investment grows at 7.7% CAGR to 2035, while fossil energy investment declines at -2.6% CAGR, as rising electrification brings an inherently more capital intensive phase, ultimately offset by lower operating costs
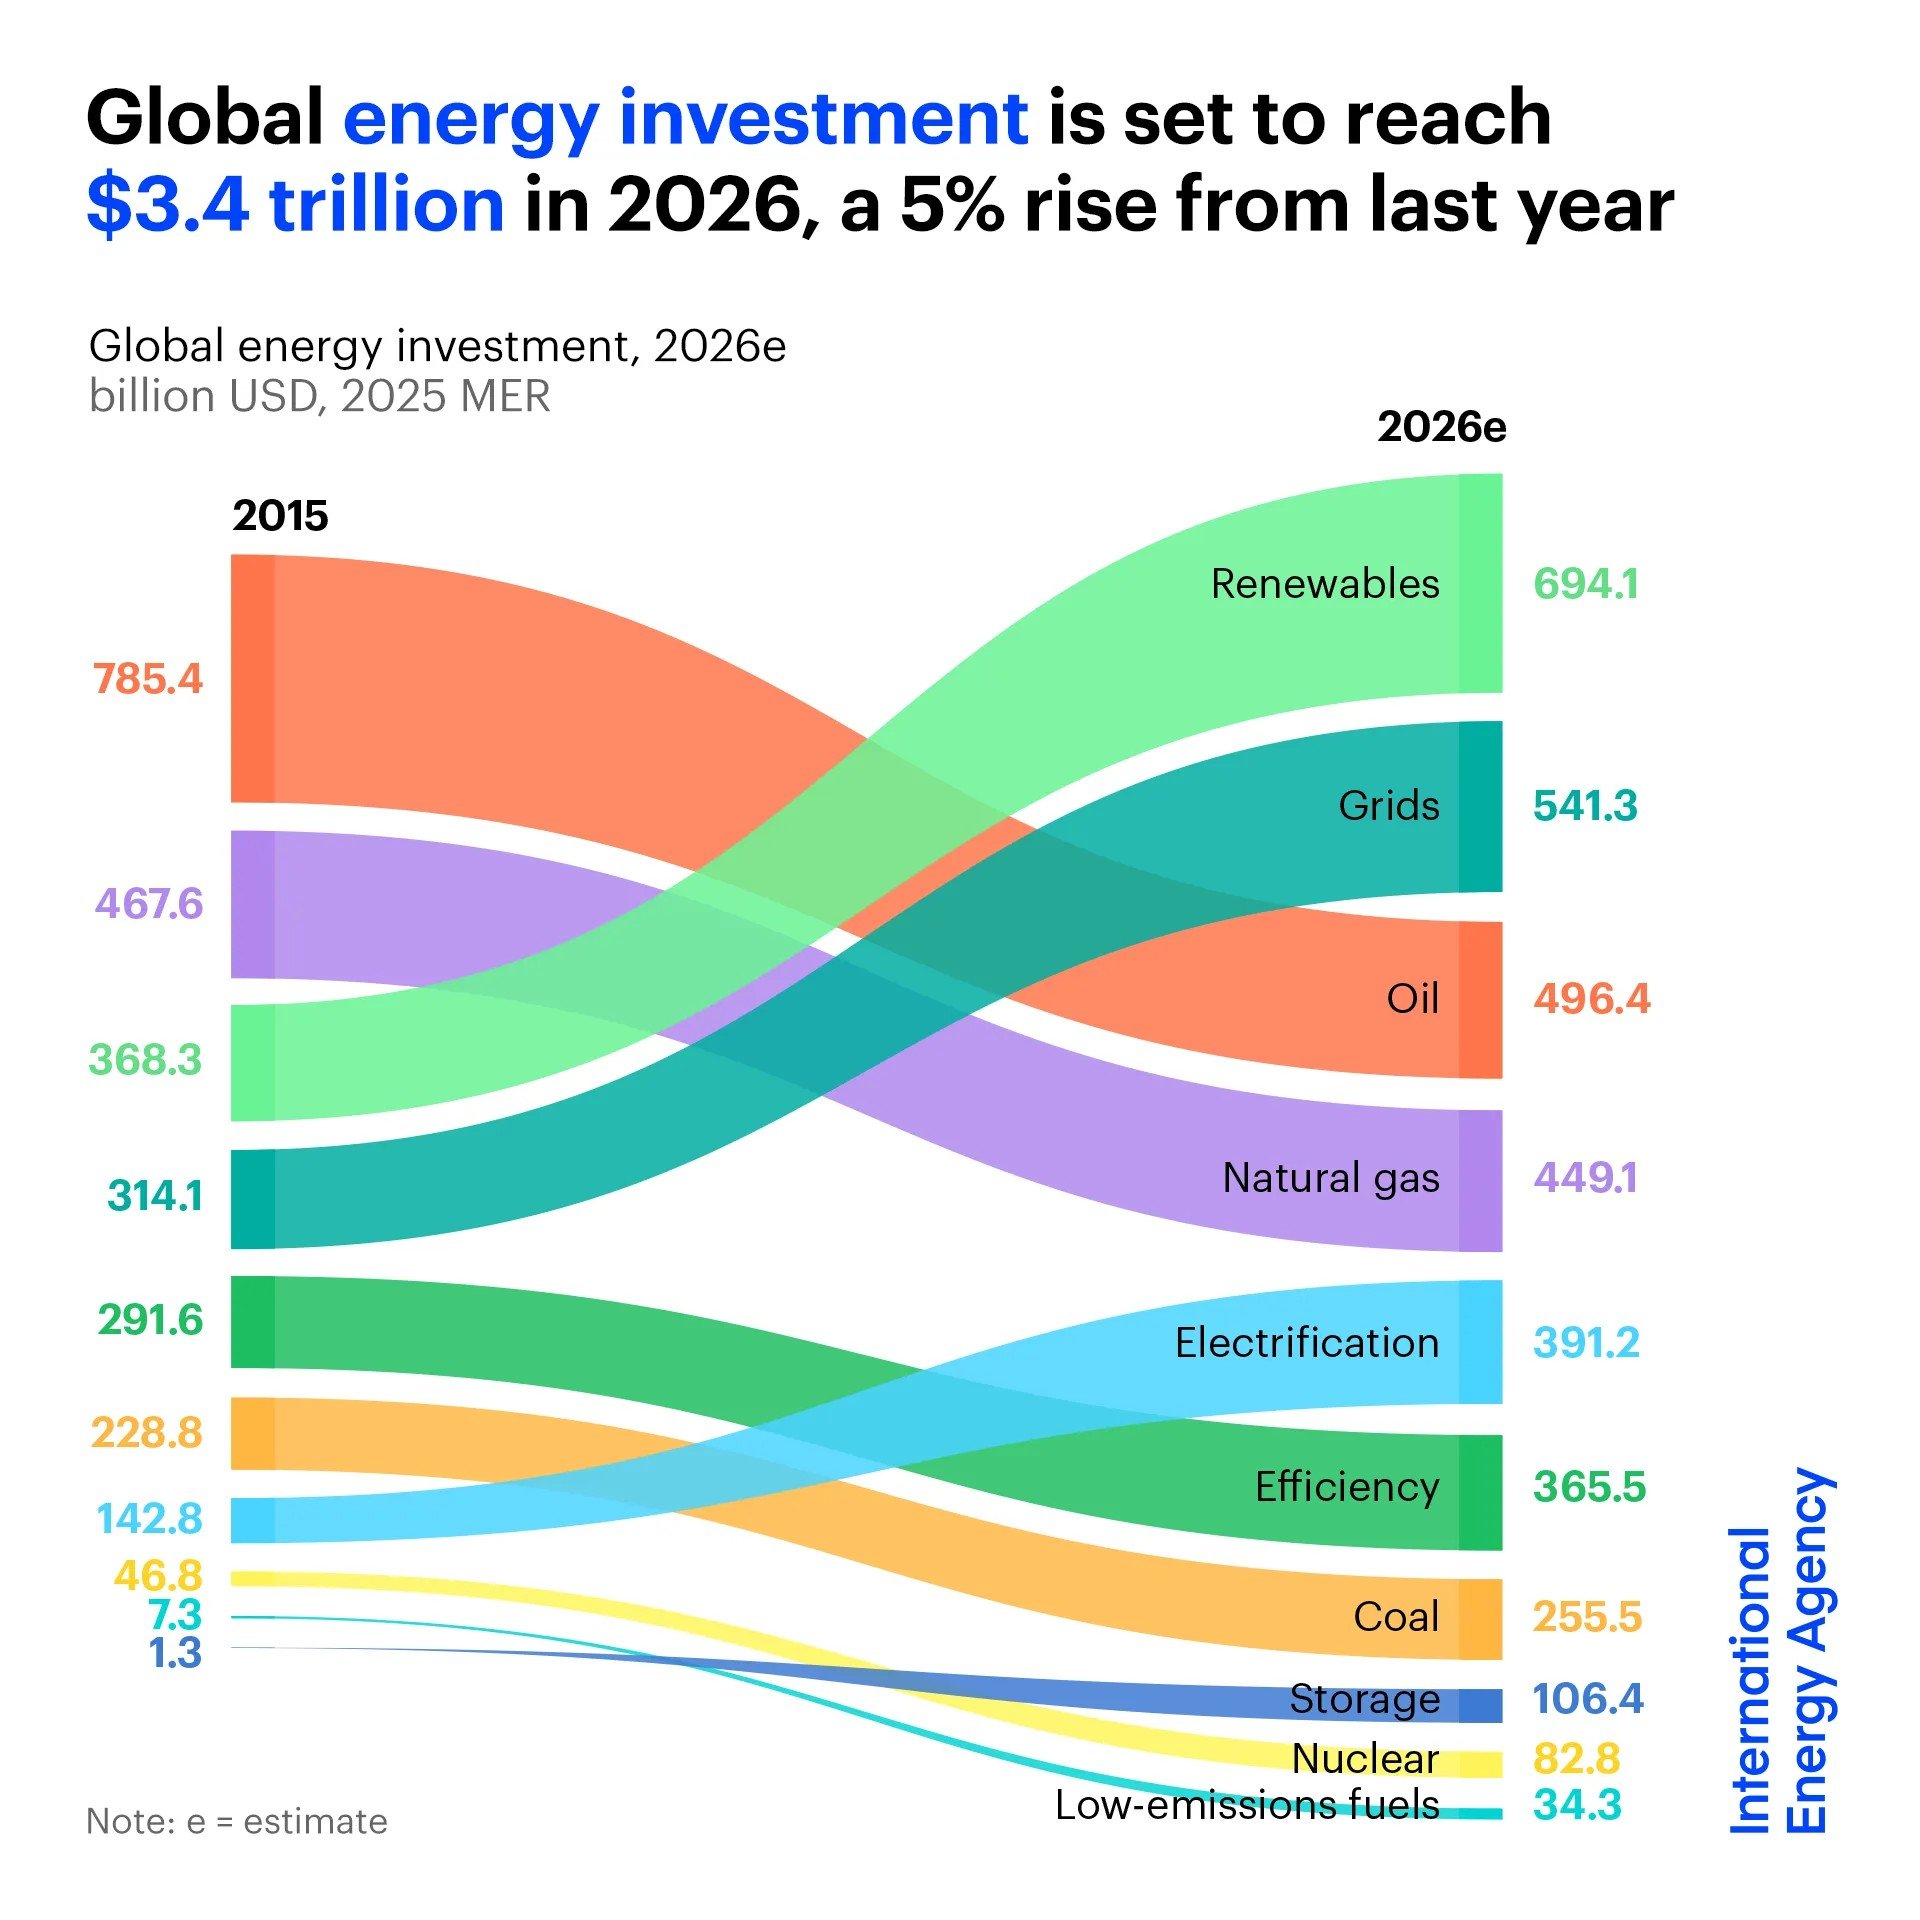
Change in investment by energy type, 2015-26E. Source: IEA
The underlying data can unlock more insight by helping to visualise two things:
Compound annual growth rates (CAGRs) for each energy / technology type over the past decade
Resulting changes in share of total investment over that period
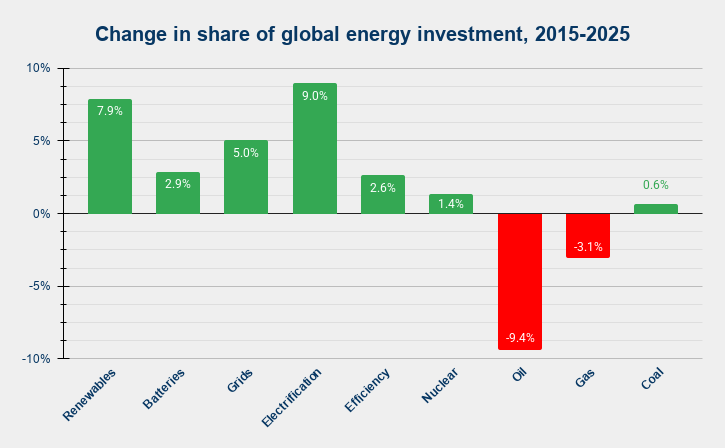
Change in share of global energy investment, 2015-25. Source: Strome Forecasting Energy System Transformation (FOREST) model. Underlying data: IEA
Over the decade to 2025, total energy investment rose from $2.6 trillion to $3.3 trillion, measured in real (inflation-adjusted) 2025 USD. That is aggregate growth of 23%, or a CAGR of 2.1%/pa.
In terms of growth rates, one energy technology immediately jumps out: battery storage. Whilst this is partly because it started from effectively zero, its CAGR of 55% over the past decade reinforces the message of Edition 22: batteries are going from the margins to play a significant systemic role in a historically short timescale. Especially given that every dollar, euro or yuan spent on batteries buys more performance every year, thanks to continued cost declines.
End use electrification expenditure, starting from a much higher base of $162 billion in 2015, also grew at a notably strong 9% CAGR. By contrast, both oil and gas investment declined at compound rates of just under 4% and 2% respectively over that decade, albeit with cyclical fluctuations. Over the last five years global gas investment has actually grown at 7%/pa, as the LNG buildout has ramped up in the USA, Qatar and Australia.
This is reflected in the changes in shares of total energy investment over that period: electrification (+9.0%, from 6.1% to 15.1%) and renewables (+7.9%, from 13.2% to 21.1%) gained the most, mainly at the expense of oil (-9.4%, from 28.6% to 19.2%) but also gas (-3.1%, from 18.6% to 15.5%). In absolute terms, electrification investment more than doubled, reaching fifth largest share just behind gas, while renewables spend rose 1.9x to take the top spot. Grid expenditure also increased its share from 11.8% to 16.9%, rising from fourth to second place. The shares of energy efficiency, nuclear and coal expenditure did not change materially.
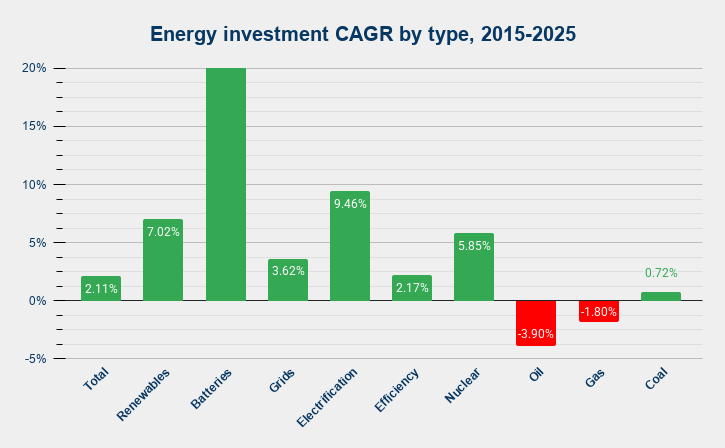
Energy investment CAGR by type, 2015-25, zoomed in to show the differences more clearly. The CAGR of battery storage was 55%, from $1bn to $78bn. Source: FOREST / IEA
Looking ahead
This rear mirror view helps us consider the road ahead. What major energy investment shifts can we expect for the next decade, and what kind of energy system will that build?
Our base case assumes more continuity than change in investment trends. We don’t need to make any heroic assumptions to fit a particular worldview. One notable change is that we do assume that the CAGR of battery storage investment will fall to 19.9% over the next decade as it naturally runs into the law of large numbers.
The 10-year CAGR assumptions in our Forecasting Energy System Transformation (FOREST) model base case are shown in the right hand column below, alongside the actual CAGRs for the past 10, 5 and 3 years:
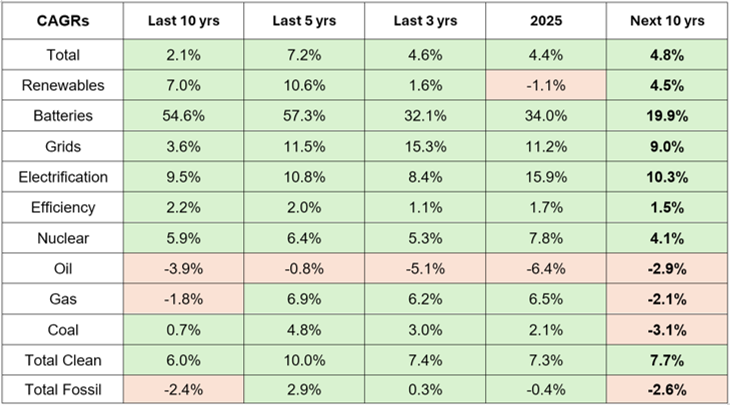
These 10-year forward CAGRs produce the following base case scenario to 2035:
Source: IEA (past data and 2026E), Strome FOREST model (forward assumptions)
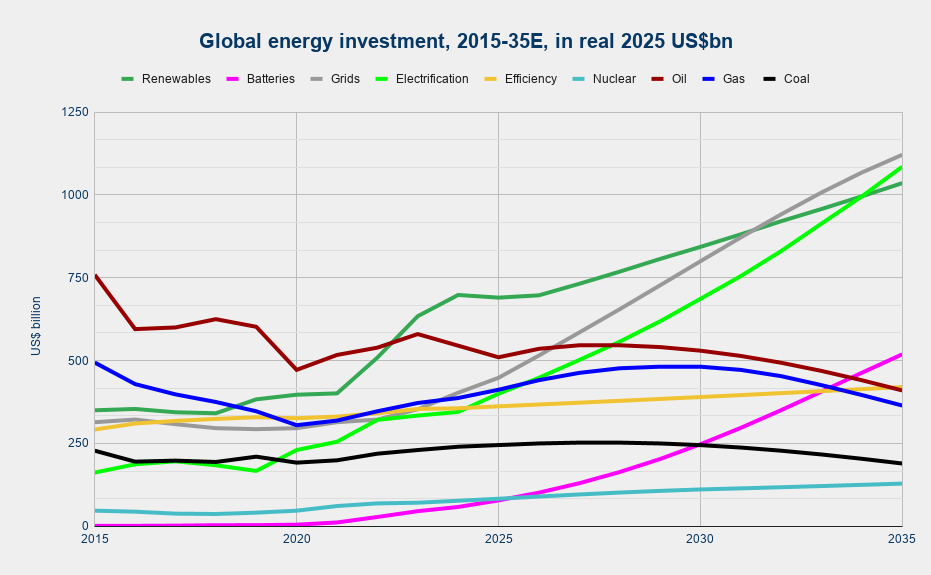
Forecast global energy investment, 2015-35E, in real 2025 $bn. Source: FOREST / IEA
The key messages:
Grid investment more than doubles from $448bn/pa to $1.1tn/pa (in real 2025 USD terms) reflecting the universal need for new transmission, distribution and associated critical infrastructure
Electrification investment nearly triples from $400bn/pa to $1.1bn/pa, reflecting its deep economic, energy security and environmental benefits
Battery storage investment grows fastest, rising nearly 7x from $78bn/pa to $519bn/pa. Ongoing cost declines and extended durations translate this into ~15x growth in actual battery capacity by 2035, in GWh terms.
Renewables investment, already higher and more mature, rises at a steadier 4.5% CAGR from $690bn/pa to just over $1tn/pa, losing overall investment share
Both oil and gas investment each fall below $0.5tn/pa, the vast majority of which goes towards maintaining existing production rather than adding more capacity
Energy efficiency investment remains the relative laggard within the clean energy space, rising only gradually from under $300bn/pa in 2015 to over $400bn/pa in 2035, although in practice most efficiency gains will come from electrification
Coal investment remains fairly flat in real terms, again mainly to maintain existing output as coal demand peaks during this decade
Nuclear investment levels remain below all other main types as the technology remains too big, slow and expensive to really scale effectively
So grids, electrification and batteries take rising shares of energy investment. While renewables continue to grow in absolute terms, their share of total investment has likely just peaked and will decline slightly over the next decade, alongside bigger falls in share for oil, gas, coal and energy efficiency investment.
It’s also worth remembering that the relationship between growth in investment and growth in capacity and/or output is not linear. Every solar or battery investment today buys significantly more than it did ten years ago. Although cost decline curves are naturally flattening, we can expect costs to keep grinding lower over the next decade, making future investment stretch further. At the same time, not all clean energy technologies benefit from modular manufacturing economies of scale - there are other notable areas such as critical grid components where costs look likely to continue inflating significantly as demand races ahead of supply.
Clean vs fossil energy investment: from equal to double to quadruple
Pulling these strands together, the CAGRs above imply that clean investment (which includes grids and nuclear) grows at a 7.7% compound annual rate to 2035, as the energy economy shifts to a more capital intensive phase. That represents an increase from $2.1 trillion in 2025 to $4.3 trillion in real 2025 USD terms. Meanwhile, by contrast, fossil investment declines at a CAGR of -2.6%, from just under $1.2 trillion in 2025 to just under $1.0 trillion by 2035. Taken together, this means a combined total energy investment CAGR of 4.8%, rising from $3.3 trillion in 2025 to $5.3 trillion in 2035 (all numbers in real 2025 USD terms).
This reveals three distinct phases for the clean:fossil investment ratio:
Equalisation: 2015-2020 - when clean energy investment drew level with fossil
Divergence: 2021-2025 - when clean started to pull away, reaching nearly 2:1 ratio
Transformation: 2026-2035 - when clean looks set to reach 4x the fossil investment level
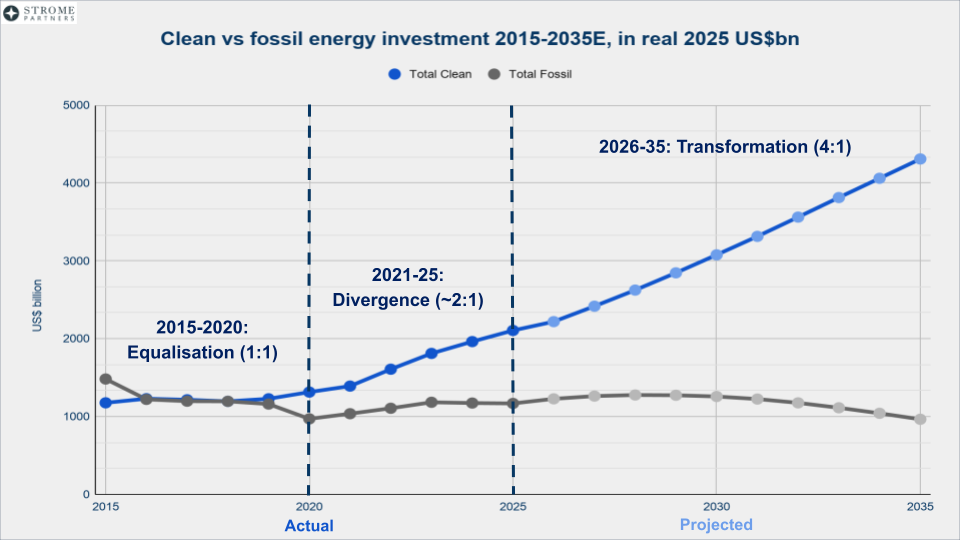
Clean:fossil energy investment 2015-35E, in real 2025 $bn. Source: FOREST / IEA
What this means is that as of 2028, all future net growth in energy investment will be in clean technologies, primarily grids, storage, electrification and renewables. From then on, the clean:fossil discrepancy widens as global oil and coal demand start their terminal decline, with gas demand likely to peak a few years later.
Finally, it is also worth remembering that not all investment is equal. The nature of clean energy investment is essentially to accumulate infrastructure which harnesses effectively limitless ambient energy potential, whereas the nature of fossil energy investment is to continually replace production that is used up by single-use combustion. By 2035, 80% of all new energy investment will be clean, while the other 20% will only maintain existing fossil production capacity, with no economic incentive to expand it further.