


ENERGIZED: Investment Insights on Energy Transformation
Edition 24
The Battery Revolution Part 2: Electric Cars
The Rise, Fall and Rise of BYD
15 September 2026
From landline to smartphone
There is a popular analogy among avid EV-market watchers. We have moved into an era when driving a diesel or petrol car is like communicating via a landline and dial-up internet. That makes owning a hybrid plug-in vehicle (PHEV) akin to the proverbial brick phone and a full battery electric vehicle (BEV) like owning the latest high-performance smartphone. The whole category is being redefined. A BEV is not just a car: it is mobile AI, hyper-intelligent and virtually autonomous, the future on wheels, the machine that embodies machine learning, accelerating silently and effortlessly into the distance.
The comparison works because in both cases we’re talking about disruption of a huge industry meeting a basic human need: communication and transportation. In the case of communication, the limits of what consumers thought was possible exploded beyond all recognition. We are witnessing the early stages of something similar in road transport. In fact, the latest BEVs charge much faster than a smartphone and their key component - the battery - can now be cycled up to 5,000 or more times, giving them effectively almost infinite lifespans. If you’ve never bought a BEV before, when you do so it may be the last car you ever buy.
Transport electrification is a once-in-a-generation megatrend for energy transition investors. But it’s highly competitive and dynamic, so what is the best and safest route to play it? For many years, the stock answer was Tesla, the original EV household name. For several reasons that’s no longer true. As its leader got distracted, Tesla has rapidly been eclipsed. It is now more incumbent than disruptor. A decade from now it may well all look different again. But right now, it’s Chinese EV manufacturers (OEMs) who have the momentum. In a price-sensitive industry, they enjoy the most sustainable competitive advantages. An advanced domestic battery supply chain and huge manufacturing capacity enables them to deliver consistently cheaper, better cars, which are now entering global markets at a different scale. That competitiveness draws on a decade of fierce rivalry to establish domestic dominance.
There are many contenders to the EV throne: Geely, SAIC, Chery, Changan, Leapmotor, XPeng, Xiaomi, the list goes on. But the biggest and most internationally recognised is undoubtedly BYD - “Build Your Dreams” - now the world’s largest EV manufacturer. Over the past decade, backed by high profile international investors like Berkshire Hathaway, BYD grew rapidly to become the leading EV OEM in China, selling 3.5 million cars there alone in 2025. As China matures, the obvious next step is to take on the whole world.
Building the Energized Portfolio: Should BYD be Included?
Energized started as a newsletter, but quickly also became a portfolio designed to test theories in practice. We believe it is important to back our own analysis and put our money where our mouth is. The basic objective of the Energized Portfolio is to identify and invest in up to 20 outstanding companies that are actively contributing to global energy system transformation and are good long-term investments in their own right. Our fundamental thesis is that both aspects should ultimately be closely aligned. If energy underpins the entire global economy, the energy technologies and infrastructure solutions that improve efficiency and productivity, while mitigating environmental impact of legacy energies, should also be the ones that scale commercially.
Any investment strategy needs some sort of edge - and ours is designed to function on two levels. First, in understanding energy systems: how the dynamics of how the classic security-affordability-sustainability “energy trilemma” is converging around electrified technologies to foster a future of more flexible, convenient and abundant production and consumption of energy. That is of course a very complex, nuanced picture with multiple positive and negative feedback loops competing against each other, creating all sorts of next-order effects. Second, in blending that understanding with commercial and financial analysis: to identify and track relevant companies with sustainable competitive advantage.
The investment approach rests on four main thematic pillars: electrification, renewables, flexibility and efficiency, with specific investments chosen for key sub-segments. For example, electrification, which refers to the shift in final energy use to electric solutions, includes not only road transport but also electrification of heat, strengthening of grids, supply of critical grid infrastructure, and ultimately its key constituent elements, like copper. Electrification sits on the consumption side of the equation, but is arguably the most impactful value driver of all, helping to absorb geopolitical energy shocks like 2022 and 2026, transform industries and improve economic productivity via more efficient energy conversion. We are moving from an “Age of Combustion” to an “Age of Conduction” - almost imperceptibly at first, then suddenly and irreversibly.
Today, there is no better example of electrification in action than in road transport, even if that transition is still in its early days. And the leading exponent of that transition today is BYD. So, the question naturally follows: does BYD justify a place in the Energized Portfolio? The answer requires a deep-dive not just on the company itself but the wider EV ecosystem and different forces at play across global car markets at large. Let’s dive in.
Global EV dynamics: beyond the noise
The global car market has effectively stopped growing over the past decade. In 2017-18, sales briefly topped 80 million, before slumping over 2019-22 and then recovering to around the same level by 2025. But that doesn’t tell the real story. The key distinction is the drivetrain. Global sales of internal combustion engine (ICE, i.e. petrol and diesel) car sales actually peaked back in 2017 and are already down by around one third since:
Please note: This newsletter is for general informational purposes only and should not be construed as financial, legal or tax advice nor as an invitation or inducement to engage in any specific investment activity, nor to address the specific personal requirements of any readers.
Disclosure: BYD is part of the Energized Portfolio
Key Takeaways:
Rapid market evolution has driven a fiercely competitive price war in China, compressing margins for manufacturers and pushing share prices into reverse gear. But for full battery electric vehicles (BEVs), the death of the Chinese market has been greatly exaggerated: the real crash is in petrol/diesel (ICE) and plug-in hybrid (PHEV) sales.
Led by BYD (HKG: 1211), Chinese EV manufacturers are redefining driving as a high-tech, AI-enhanced, increasingly autonomous experience supported by a fast-expanding infrastructure ecosystem - this is accelerating the inevitable shift from legacy combustion to digitalised electrification.
After years of rapid expansion, BYD endured a weak start to 2026. But this was likely a brief interlude in its deeper journey of growth from domestic powerhouse to full global behemoth. Domestic BEV demand provides a steady foundation while rapid international adoption offers substantial growth potential.
Sales of New Energy Vehicles (NEVs, especially BEVs but also PHEVs) are accelerating through a tipping point. We project worldwide sales to double from 20.7m (25% share) in 2025 to 40m (~50% share) by 2030, before reaching ~65m (~80% share) by 2035. While BEVs keep improving, the intractable conflicts driving gasoline and diesel price spikes are reinforcing the already one-third drop in global ICE sales since their 2017 peak.
A compelling mix of factors are driving BEV adoption curves: fast-improving consumer economics, more competitive offerings, superior driver experience, lower maintenance burdens and commodity price insulation. The rollout of flash-charging infrastructure to reduce recharging times will help to remove another key adoption barrier.
However, it’s still very early days in the global fleet transition: NEVs still account for barely 5% of vehicles today and <10% market share in many countries. As adoption accelerates over the next decade before eventually tapering off, the full fleet transition will take beyond 2050. The real opportunity still lies ahead.
To fulfil its big ambitions to meet this global BEV megatrend, BYD will leverage the same attributes that drove its domestic success: manufacturing scale, battery leadership, cost competitiveness and distribution network. Sales are already shifting decisively from domestic to international and from PHEVs to BEVs. Developing markets without legacy incumbent manufacturers are especially fertile.
Three crucial factors will underpin its ability to deliver at global scale:
Completion of its Blade 2.0 battery retooling to ramp up production of the next generation of ultra-fast charging, much longer range vehicles
Scaling up international manufacturing capacity as a key strategy to expand tariff-resistant access to key global markets
More than doubling its already industry-leading export fleet from 8 to 18 roll-on/roll-off ships, reaching total export capacity of 130,000 cars by 2029
BYD is also more than just a car story: it includes buses, trucks and fast-charging infrastructure, while as the world's #2 battery maker it offers exposure to rapid growth in stationary battery energy storage systems (BESS).
Recent data suggests the capacity investments and international pivot are starting to come to fruition: BYD’s net margin recovered to 4.2% in 2Q26 from a 2.7% low in 1Q26. After 8 months of year-on-year sales declines to April 2026, August sales rose 17.8% y-o-y to 440,293, a fourth consecutive 2026 monthly high, driven by overseas growth.
Current HK share price weakness, falling to a forward P/E of ~13x and <6x EV/EBITDA, therefore offers a potentially opportune long-term entry point as the next phase of growth ramps up
Key risks will need careful monitoring to validate the thesis, including competitive oversupply in a maturing Chinese market, the price war leaking out to international markets, plus FX, tariff and share dilution exposure

Global new car sales by powertrain (ICE, PHEV, BEV), 2000-26E. Source: IEA
As this International Energy Agency (IEA) chart reveals, it is growth in BEVs and to a lesser extent PHEVs, collectively NEVs, that have brought annual global car sales back above the 80m mark. The steep purple line shows their fast rising market share, reaching 25% of global sales by 2025. While the global market then slumped by 5% in the first half of 2026, NEV sales fell only marginally, thereby continuing to gain share. That puts them on track for around 30% share for 2026, as ICE sales fall especially fast in the world’s largest car market, China.
The global shift from ICE to NEVs, especially BEVs, is gathering momentum, but it still has a long way to run. Many countries are now entering or are already in the steepest part of their adoption curve, thanks to a compelling confluence of factors: from national policy incentives encouraging the switch to improving cost competitiveness (both on a total cost of ownership (TCO) basis and on a purchase price only basis), wider consumer choice, expanding charging infrastructure, battery technology improvements and all-round user experience and convenience.
Future adoption rates will likely be mainly driven by relative cost and local incentives. Our Forecasting Energy System Transformation (FOREST) global model sees NEVs reaching half of the global car market by 2030. Even with no overall market growth, that implies around 40 million NEV sales in 2030, versus 20.7 million in 2025 - effectively doubling in five years. Further out is naturally less certain, but on current adoption curves it looks entirely plausible that we’ll see 65 million/pa of total NEV sales at a market share of around 80%.
NEV is a fairly sub-optimal definition, as it includes two fundamentally different types of vehicle, fully electric BEVs and hybrid PHEVs that may prove to be the worst, not the best of both worlds. There is increasingly strong evidence that BEVs will take increasingly higher market shares relative to PHEVs, because continued battery and charging infrastructure improvements steadily reduce the need to include combustion back-up for longer trips. Batteries will do the job on their own.
In understanding where we stand today in the global NEV trajectory, it’s important to make the classic distinction between stocks and flows. Flows - market share - are heading from 25% globally last year towards 50% by 2030. But stocks reflect only past sales so naturally remain far behind. Car ownership typically lasts around 15 years, so turnover is relatively slow. That’s why NEVs are still barely 5% of the global fleet on the road today. Even if global market share evolves as fast as we currently project, with the steepest adoption over the next decade before it matures, full fleet transition wouldn’t be materially complete until at least 2050. There is still a very long runway ahead for NEV manufacturers.
The global picture naturally masks a wide variety of dynamics across different markets. Some, notably China, are already much further ahead, while others are barely getting started. Norway is the most complete case, but relatively tiny, while the US shows how ideological barriers can suppress the curve.
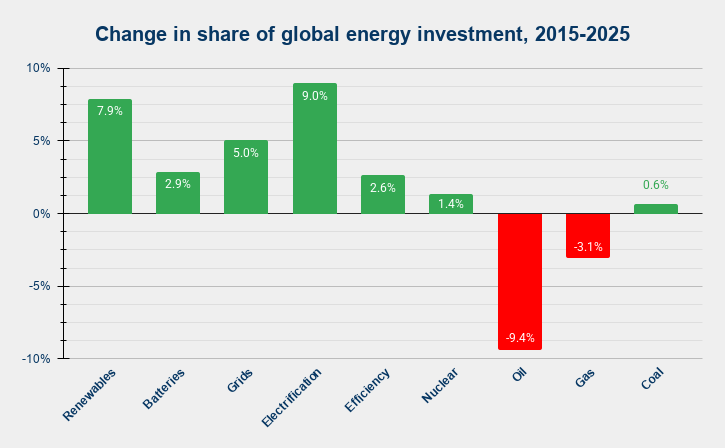
Change in share of global energy investment, 2015-25. Source: Strome Forecasting Energy System Transformation (FOREST) model. Underlying data: IEA
Over the decade to 2025, total energy investment rose from $2.6 trillion to $3.3 trillion, measured in real (inflation-adjusted) 2025 USD. That is aggregate growth of 23%, or a CAGR of 2.1%/pa.
In terms of growth rates, one energy technology immediately jumps out: battery storage. Whilst this is partly because it started from effectively zero, its CAGR of 55% over the past decade reinforces the message of Edition 22: batteries are going from the margins to play a significant systemic role in a historically short timescale. Especially given that every dollar, euro or yuan spent on batteries buys more performance every year, thanks to continued cost declines.
End use electrification expenditure, starting from a much higher base of $162 billion in 2015, also grew at a notably strong 9% CAGR. By contrast, both oil and gas investment declined at compound rates of just under 4% and 2% respectively over that decade, albeit with cyclical fluctuations. Over the last five years global gas investment has actually grown at 7%/pa, as the LNG buildout has ramped up in the USA, Qatar and Australia.
This is reflected in the changes in shares of total energy investment over that period: electrification (+9.0%, from 6.1% to 15.1%) and renewables (+7.9%, from 13.2% to 21.1%) gained the most, mainly at the expense of oil (-9.4%, from 28.6% to 19.2%) but also gas (-3.1%, from 18.6% to 15.5%). In absolute terms, electrification investment more than doubled, reaching fifth largest share just behind gas, while renewables spend rose 1.9x to take the top spot. Grid expenditure also increased its share from 11.8% to 16.9%, rising from fourth to second place. The shares of energy efficiency, nuclear and coal expenditure did not change materially.
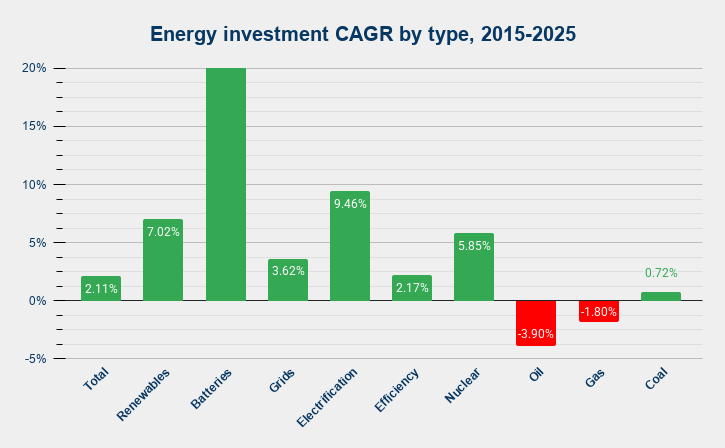
Energy investment CAGR by type, 2015-25, zoomed in to show the differences more clearly. The CAGR of battery storage was 55%, from $1bn to $78bn. Source: FOREST / IEA
Looking ahead
This rear mirror view helps us consider the road ahead. What major energy investment shifts can we expect for the next decade, and what kind of energy system will that build?
Our base case assumes more continuity than change in investment trends. We don’t need to make any heroic assumptions to fit a particular worldview. One notable change is that we do assume that the CAGR of battery storage investment will fall to 19.9% over the next decade as it naturally runs into the law of large numbers.
The 10-year CAGR assumptions in our Forecasting Energy System Transformation (FOREST) model base case are shown in the right hand column below, alongside the actual CAGRs for the past 10, 5 and 3 years:
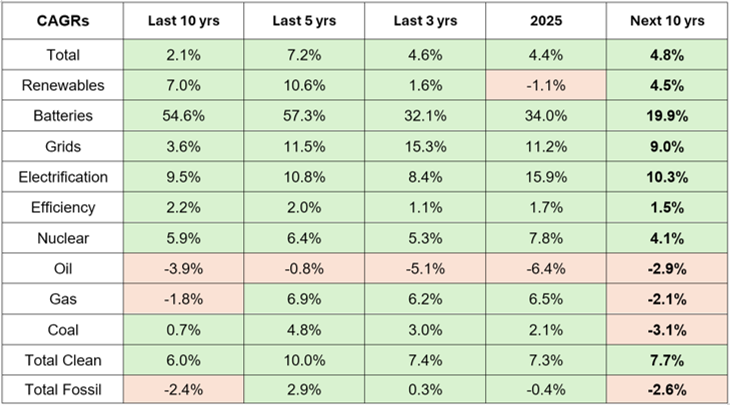
These 10-year forward CAGRs produce the following base case scenario to 2035:
Source: IEA (past data and 2026E), Strome FOREST model (forward assumptions)
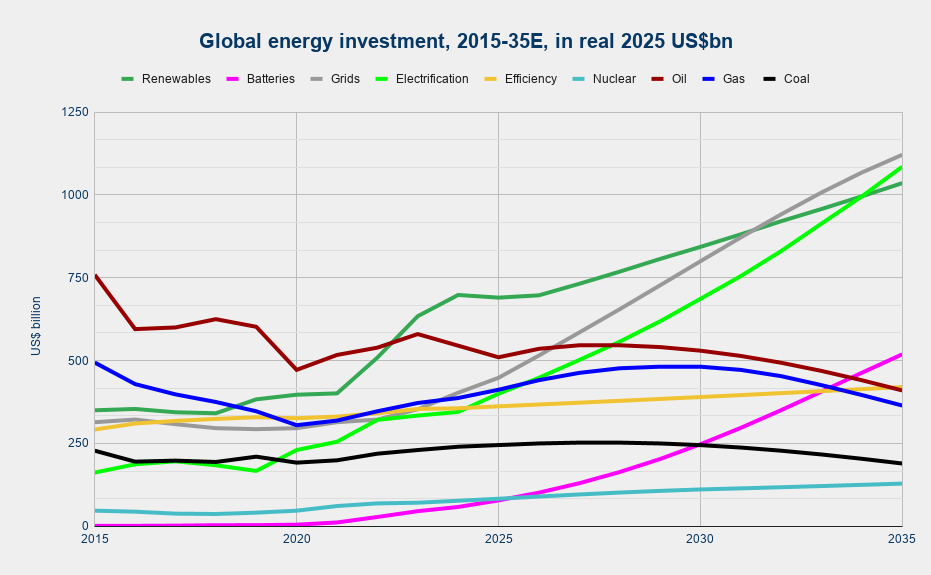
Forecast global energy investment, 2015-35E, in real 2025 $bn. Source: FOREST / IEA
The key messages:
Grid investment more than doubles from $448bn/pa to $1.1tn/pa (in real 2025 USD terms) reflecting the universal need for new transmission, distribution and associated critical infrastructure
Electrification investment nearly triples from $400bn/pa to $1.1bn/pa, reflecting its deep economic, energy security and environmental benefits
Battery storage investment grows fastest, rising nearly 7x from $78bn/pa to $519bn/pa. Ongoing cost declines and extended durations translate this into ~15x growth in actual battery capacity by 2035, in GWh terms.
Renewables investment, already higher and more mature, rises at a steadier 4.5% CAGR from $690bn/pa to just over $1tn/pa, losing overall investment share
Both oil and gas investment each fall below $0.5tn/pa, the vast majority of which goes towards maintaining existing production rather than adding more capacity
Energy efficiency investment remains the relative laggard within the clean energy space, rising only gradually from under $300bn/pa in 2015 to over $400bn/pa in 2035, although in practice most efficiency gains will come from electrification
Coal investment remains fairly flat in real terms, again mainly to maintain existing output as coal demand peaks during this decade
Nuclear investment levels remain below all other main types as the technology remains too big, slow and expensive to really scale effectively
So grids, electrification and batteries take rising shares of energy investment. While renewables continue to grow in absolute terms, their share of total investment has likely just peaked and will decline slightly over the next decade, alongside bigger falls in share for oil, gas, coal and energy efficiency investment.
It’s also worth remembering that the relationship between growth in investment and growth in capacity and/or output is not linear. Every solar or battery investment today buys significantly more than it did ten years ago. Although cost decline curves are naturally flattening, we can expect costs to keep grinding lower over the next decade, making future investment stretch further. At the same time, not all clean energy technologies benefit from modular manufacturing economies of scale - there are other notable areas such as critical grid components where costs look likely to continue inflating significantly as demand races ahead of supply.
Clean vs fossil energy investment: from equal to double to quadruple
Pulling these strands together, the CAGRs above imply that clean investment (which includes grids and nuclear) grows at a 7.7% compound annual rate to 2035, as the energy economy shifts to a more capital intensive phase. That represents an increase from $2.1 trillion in 2025 to $4.3 trillion in real 2025 USD terms. Meanwhile, by contrast, fossil investment declines at a CAGR of -2.6%, from just under $1.2 trillion in 2025 to just under $1.0 trillion by 2035. Taken together, this means a combined total energy investment CAGR of 4.8%, rising from $3.3 trillion in 2025 to $5.3 trillion in 2035 (all numbers in real 2025 USD terms).
This reveals three distinct phases for the clean:fossil investment ratio:
Equalisation: 2015-2020 - when clean energy investment drew level with fossil
Divergence: 2021-2025 - when clean started to pull away, reaching nearly 2:1 ratio
Transformation: 2026-2035 - when clean looks set to reach 4x the fossil investment level
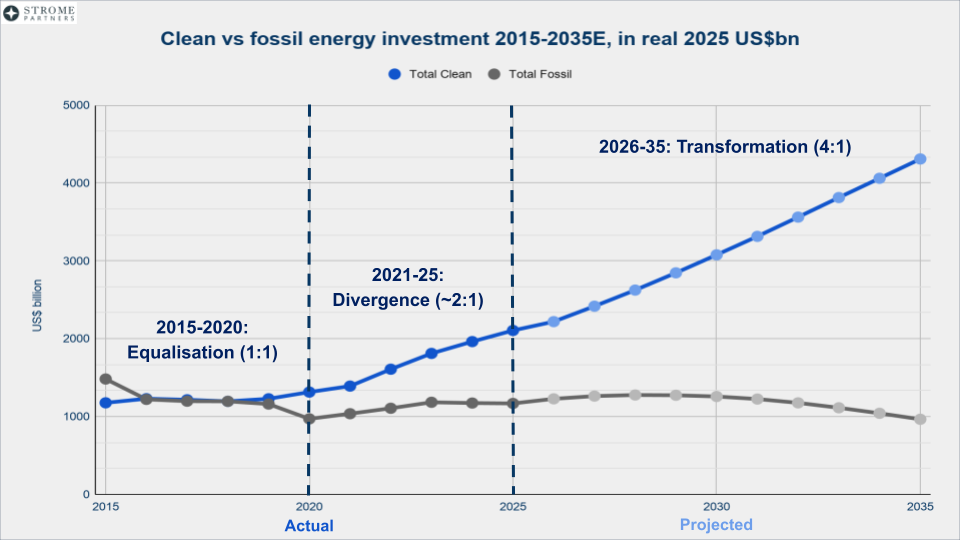
Clean:fossil energy investment 2015-35E, in real 2025 $bn. Source: FOREST / IEA
What this means is that as of 2028, all future net growth in energy investment will be in clean technologies, primarily grids, storage, electrification and renewables. From then on, the clean:fossil discrepancy widens as global oil and coal demand start their terminal decline, with gas demand likely to peak a few years later.
Finally, it is also worth remembering that not all investment is equal. The nature of clean energy investment is essentially to accumulate infrastructure which harnesses effectively limitless ambient energy potential, whereas the nature of fossil energy investment is to continually replace production that is used up by single-use combustion. By 2035, 80% of all new energy investment will be clean, while the other 20% will only maintain existing fossil production capacity, with no economic incentive to expand it further.