

ENERGIZED: Investment Insights on Energy Transformation
Edition 24
The Battery Revolution Part 2: EVs
The Rise, Fall and Redemption of BYD
15 September 2026
The paradigm shift: from landline to smartphone
There is currently a popular analogy among avid EV-market watchers. We have moved into an era when driving a diesel or petrol car is like communicating via a landline and dial-up internet. That makes owning a hybrid plug-in vehicle (PHEV) akin to the proverbial brick phone and a full battery electric vehicle (BEV) like owning the latest high-performance smartphone. The whole category is being redefined. A BEV is not just a car: it is mobile AI, hyper-intelligent and virtually autonomous, the future on wheels, the machine that embodies machine learning, accelerating silently and effortlessly into the distance.
The comparison works because in both cases we’re talking about disruption of a huge industry meeting a basic human need: communication and transportation. In the case of communication, the limits of what consumers thought was possible exploded beyond all recognition. We are witnessing the early stages of something similar in road transport. In fact, the latest BEVs charge much faster than a smartphone and their key component - the battery - can now be cycled up to 5,000 or more times, giving them effectively almost infinite lifespans. If you’ve never bought a BEV before, when you do so it may be the last car you ever buy.
Transport electrification is a once-in-a-generation megatrend for energy transition investors. But it’s highly competitive and dynamic, so what is the best and safest route to play it? For many years, the stock answer was Tesla, the original EV household name. For several reasons that’s no longer true. As its leader got distracted, Tesla has rapidly been eclipsed. It is now more incumbent than disruptor. A decade from now it may well all look different again. But right now, it’s Chinese EV manufacturers (OEMs) who have the momentum. In a price-sensitive industry, they enjoy the most sustainable competitive advantages. An advanced domestic battery supply chain and huge manufacturing capacity enables them to deliver consistently cheaper, better cars, which are now entering global markets at a different scale. That competitiveness draws on a decade of fierce rivalry to establish domestic dominance.
There are many contenders to the EV throne: Geely, SAIC, Chery, Changan, Leapmotor, XPeng, Xiaomi, the list goes on. But the biggest and most internationally recognised is undoubtedly BYD - “Build Your Dreams” - now the world’s largest EV manufacturer. Over the past decade, backed by high profile international investors like Berkshire Hathaway, BYD grew rapidly to become the leading EV OEM in China, selling 3.5 million cars there alone in 2025. As China matures, the obvious next step is to take on the whole world.
Building the Energized Portfolio: Should BYD be Included?
Energized started as a newsletter, but quickly also became a portfolio designed to test theories in practice. We believe it is important to back our own analysis and put our money where our mouth is. The basic objective of the Energized Portfolio is to identify and invest in up to 20 outstanding companies that are actively contributing to global energy system transformation and are good long-term investments in their own right. Our fundamental thesis is that both aspects should ultimately be closely aligned. If energy underpins the entire global economy, the energy technologies and infrastructure solutions that improve efficiency and productivity, while mitigating environmental impact of legacy energies, should also be the ones that scale commercially.
Any investment strategy needs some sort of edge - and ours is designed to function on two levels. First, in understanding energy systems: how the dynamics of how the classic security-affordability-sustainability “energy trilemma” is converging around electrified technologies to foster a future of more flexible, convenient and abundant production and consumption of energy. That is of course a very complex, nuanced picture with multiple positive and negative feedback loops competing against each other, creating all sorts of next-order effects. Second, in blending that understanding with commercial and financial analysis: to identify and track relevant companies with sustainable competitive advantage.
The investment approach rests on four main thematic pillars: electrification, renewables, flexibility and efficiency, with specific investments chosen for key sub-segments. For example, electrification, which refers to the shift in final energy use to electric solutions, includes not only road transport but also electrification of heat, strengthening of grids, supply of critical grid infrastructure, and ultimately its key constituent elements, like copper. Electrification sits on the consumption side of the equation, but is arguably the most impactful value driver of all, helping to absorb geopolitical energy shocks like 2022 and 2026, transform industries and improve economic productivity via more efficient energy conversion. We are moving from an “Age of Combustion” to an “Age of Conduction” - almost imperceptibly at first, then suddenly and irreversibly.
Today, there is no better example of electrification in action than in road transport, even if that transition is still in its early days. And the leading exponent of that transition today is BYD. So, the question naturally follows: does BYD justify a place in the Energized Portfolio? The answer requires a deep-dive not just on the company itself but the wider EV ecosystem and different forces at play across global car markets at large. Let’s dive in.
Global EV dynamics: beyond the noise
The global car market has effectively stopped growing over the past decade. In 2017-18, sales briefly topped 80 million, before slumping over 2019-22 and then recovering to around the same level by 2025. But that doesn’t tell the real story. The key distinction is the drivetrain. Global sales of internal combustion engine (ICE, i.e. petrol and diesel) car sales actually peaked back in 2017 and are already down by around one third since:
Please note: This newsletter is for general informational purposes only and should not be construed as financial, legal or tax advice nor as an invitation or inducement to engage in any specific investment activity, nor to address the specific personal requirements of any readers.
Disclosure: BYD is part of the Energized Portfolio
Key Takeaways:
Rapid market evolution has driven a fiercely competitive price war in China, compressing margins for manufacturers and pushing share prices into reverse. But for full battery electric vehicles (BEVs), the death of the Chinese market has been greatly exaggerated: the real crash is in petrol/diesel (ICE) and plug-in hybrid (PHEV) sales.
Led by BYD (HKG: 1211), Chinese EV manufacturers are redefining driving as a high-tech, AI-enhanced, increasingly autonomous experience supported by an expanding fast-charging ecosystem - accelerating the inevitable shift in road transport from inefficient combustion to digitalised electrification.
After years of rapid expansion, BYD endured a weak start to 2026. But this was likely a brief interlude in its deeper journey of growth from domestic powerhouse to full global behemoth. Domestic BEV demand provides a steady foundation while rapid international adoption offers substantial growth potential.
High gasoline and diesel prices driven by intractable conflicts in the Middle East and Russia-Ukraine are reinforcing the already one-third drop in global ICE sales since their 2017 peak and pushing sales of New Energy Vehicles (NEVs, especially BEVs but also PHEVs) past tipping points in many markets. We project worldwide NEV sales to double from 20.7m (25% share) in 2025 to ~40m (~50% share) by 2030, before reaching ~65m (~80% share) by 2035.
A compelling mix of factors are driving adoption curves: fast-improving consumer economics, more competitive offerings, superior driver experience, lower maintenance burdens and commodity price insulation. The rollout of flash-charging infrastructure to reduce recharging times will help to remove another key adoption barrier.
However, it’s still very early days - the real opportunity for EV OEMs to supply this global megatrend still lies ahead. NEVs still account for barely 5% of vehicles on the road today and <10% market share in many countries. Adoption will accelerate over the next decade before eventually tapering off. Full fleet transition will take beyond 2050.
To fulfil its big international ambitions, BYD will leverage the same attributes that drove its domestic success: manufacturing scale, battery leadership, cost competitiveness and distribution network. Sales are already shifting decisively from domestic to international and from PHEVs to BEVs. Developing markets without legacy incumbent manufacturers are especially fertile ground.
Three crucial factors will underpin its ability to deliver at global scale and uphold profit margins:
Completion of its Blade 2.0 battery retooling to ramp up production of the next generation of ultra-fast charging, much longer range models
Scaling up international manufacturing capacity as a key strategy to expand tariff-resistant access to key global markets
More than doubling its already industry-leading export fleet from 8 to 18 roll-on/roll-off ships, reaching total export capacity of 130,000 cars by 2029
BYD is also more than just a car story: it includes buses, trucks and fast-charging infrastructure, while as the world's #2 battery maker it offers exposure to rapid growth in stationary battery energy storage systems (BESS).
Latest data suggests the capacity investments and international pivot are starting to come to fruition: BYD’s net margin recovered to 4.2% in 2Q26 from a 2.7% low in 1Q26. After 8 months of year-on-year sales declines to April 2026, August sales rose 17.8% y-o-y to 440,293, a fourth consecutive 2026 monthly high, driven by overseas growth.
Current share price weakness, falling to a forward P/E of ~13x and <6x EV/EBITDA, therefore offers a potentially opportune long-term entry point as the next phase of growth ramps up
Key risks will need careful monitoring to validate the thesis, including oversupply turning the Chinese price war international, plus FX, tariff and share dilution exposure

Global new car sales by powertrain (ICE, PHEV, BEV), 2000-26E. Source: IEA
As this International Energy Agency (IEA) chart reveals, it is growth in BEVs and to a lesser extent PHEVs, collectively NEVs, that have brought annual global car sales back above the 80m mark. The steep purple line shows their fast rising market share, reaching 25% of global sales by 2025. While the global market then slumped by 5% in the first half of 2026, NEV sales fell only marginally, thereby continuing to gain share. That puts them on track for around 30% share for 2026, as ICE sales fall especially fast in the world’s largest car market, China.
The global shift from ICE to NEVs, especially BEVs, is gathering momentum, but it still has a long way to run. Many countries are now entering or are already in the steepest part of their adoption curve, thanks to a compelling confluence of factors: from national policy incentives encouraging the switch to improving cost competitiveness (both on a total cost of ownership (TCO) basis and on a purchase price only basis), wider consumer choice, expanding charging infrastructure, battery technology improvements and all-round user experience and convenience.
Future adoption rates will likely be mainly driven by relative cost and local incentives. Our Forecasting Energy System Transformation (FOREST) global model sees NEVs reaching half of the global car market by 2030. Even with no overall market growth, that implies around 40 million NEV sales in 2030, versus 20.7 million in 2025 - effectively doubling in five years. Further out is naturally less certain, but on current adoption curves it looks entirely plausible that we’ll see 65 million/pa of total NEV sales at a market share of around 80%. (NEV is an increasingly sub-optimal definition, comprising two fundamentally different types of vehicle, fully electric BEVs and hybrid PHEVs. Evidence is mounting that BEVs will take ever higher market shares relative to PHEVs, because continued battery and charging infrastructure improvements steadily reduce the need for combustion back-up, even for longer trips. Batteries will do the job on their own.)
Distinguishing between stocks and flows is crucial to understand the global EV trajectory. Even as flows - market share - rise from 25% last year towards 50% by 2030, stocks - the on-the-road fleet - remain far behind at barely 5% today, reflecting only past sales. Car ownership typically lasts around 15 years, so turnover is gradual. Adoption looks set to accelerate over the next decade before eventually tapering off, but full fleet transition wouldn’t be materially complete until after 2050. That leaves a very healthy runway ahead for EV manufacturers. Of course, this global picture masks a wide variety of different markets. Many advanced EV markets are relatively small. China is the only major market with advanced EV adoption to date. Others like India, the US and Russia are still barely getting started.
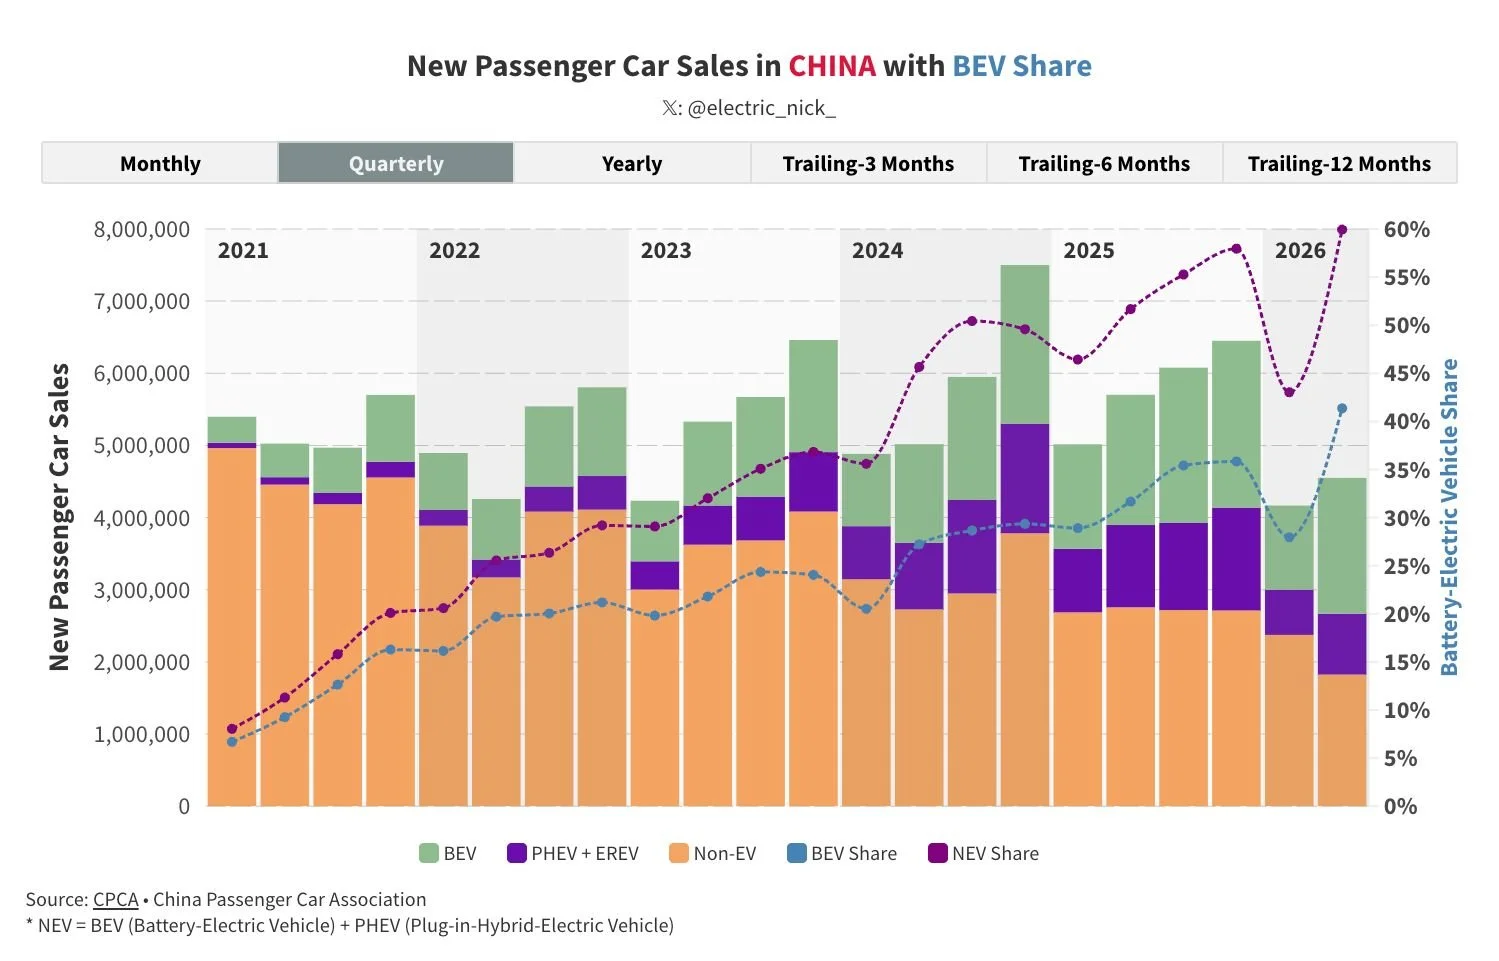
Quarterly new passenger car sales in China by type. Source: China Passenger Car Association (CPCA) via Electric Nick
A tale of two markets
Today, BYD has already overtaken Tesla to become the world’s leading EV manufacturer. But it finds itself at a crossroads between two opposing dynamics: a large but maturing domestic market versus rapid growth across smaller but fast-growing international markets. These mixed signals have impacted its share price in 2026, as slowing sales and lower margins in China have spooked investors. BYD suddenly appeared more vulnerable.
The elephant in the room is the slowdown in its own back yard. China’s car market has entered a more mature phase, hitting both volumes and margins for all manufacturers. Passenger car sales fell by over 20% in China over the first half of 2026.
This is partly demographics: urban population numbers are plateauing. But the split by drivetrain reveals the real story: ICE sales fell by 23%, PHEV by 27%, but BEV by only 6%. Unsurprisingly, higher oil prices have accelerated the structural shift from ICE to BEV. This China car sales chart shows ICE (orange bars) continuing their steady decline to a new quarterly low. PHEV sales (purple bars) were also well down in both 1Q26 and 2Q26. By contrast, after a weak 1Q26, BEV sales rebounded in 2Q26.
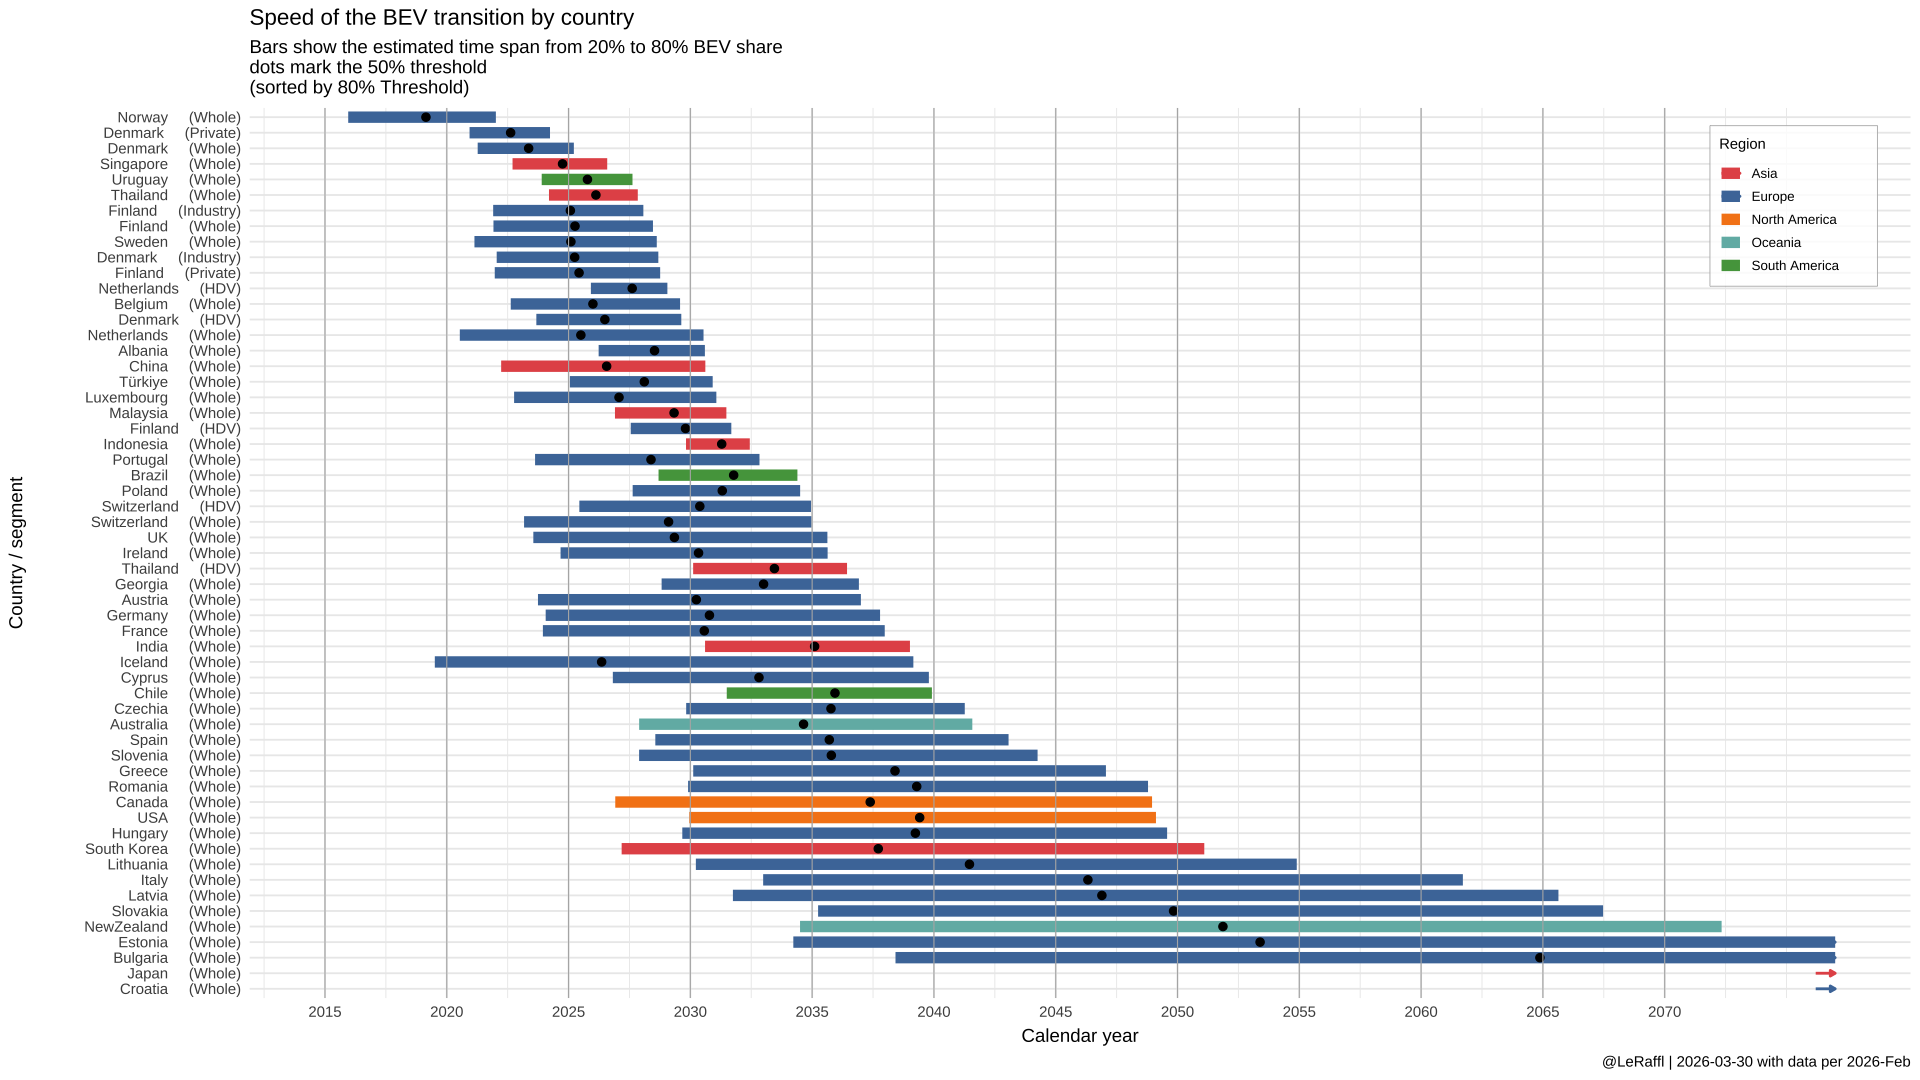
Projected transition (BEV only) by selected country. Source: LeRaffl https://leraffl.github.io/LeRaffl-Gallery/#gallery
It’s already effectively game over for ICE in China, but substitution is continually speeding up - with ICE sales now down 40% since March. The shift has strengthened over 3Q26. On a trailing 12-months (TTM) basis to August 2026, BEVs took 37.1% of new car sales in China (versus 31.0% for the prior 12-month period), with PHEV on 20.4% (15.6%) and ICE on 42.5% (53.4%). This shift is enabling Chinese authorities to start easing off the policies stimulating BEV sales and let the market take its course. Such incentives have much more impact if implemented early and then gradually withdrawn later. In systems terms, early intervention is disproportionately more impactful than later intervention, enabling an earlier tipping point. In China’s case the evidence now suggests that the ICE-BEV tipping point has been reached. NEVs already account for two thirds of the Chinese car market, and two thirds of those are BEVs.
Despite the gloomy headlines, the Chinese BEV market actually looks pretty robust. On a TTM basis, BEV only sales (excluding PHEVs) have risen from below 15% in early 2022 to 37% now. On a monthly basis, they have now already overtaken ICE sales.
China BEV sales, trailing 12-month view to 30 June 2026. Source: CPCA via Electric Nick
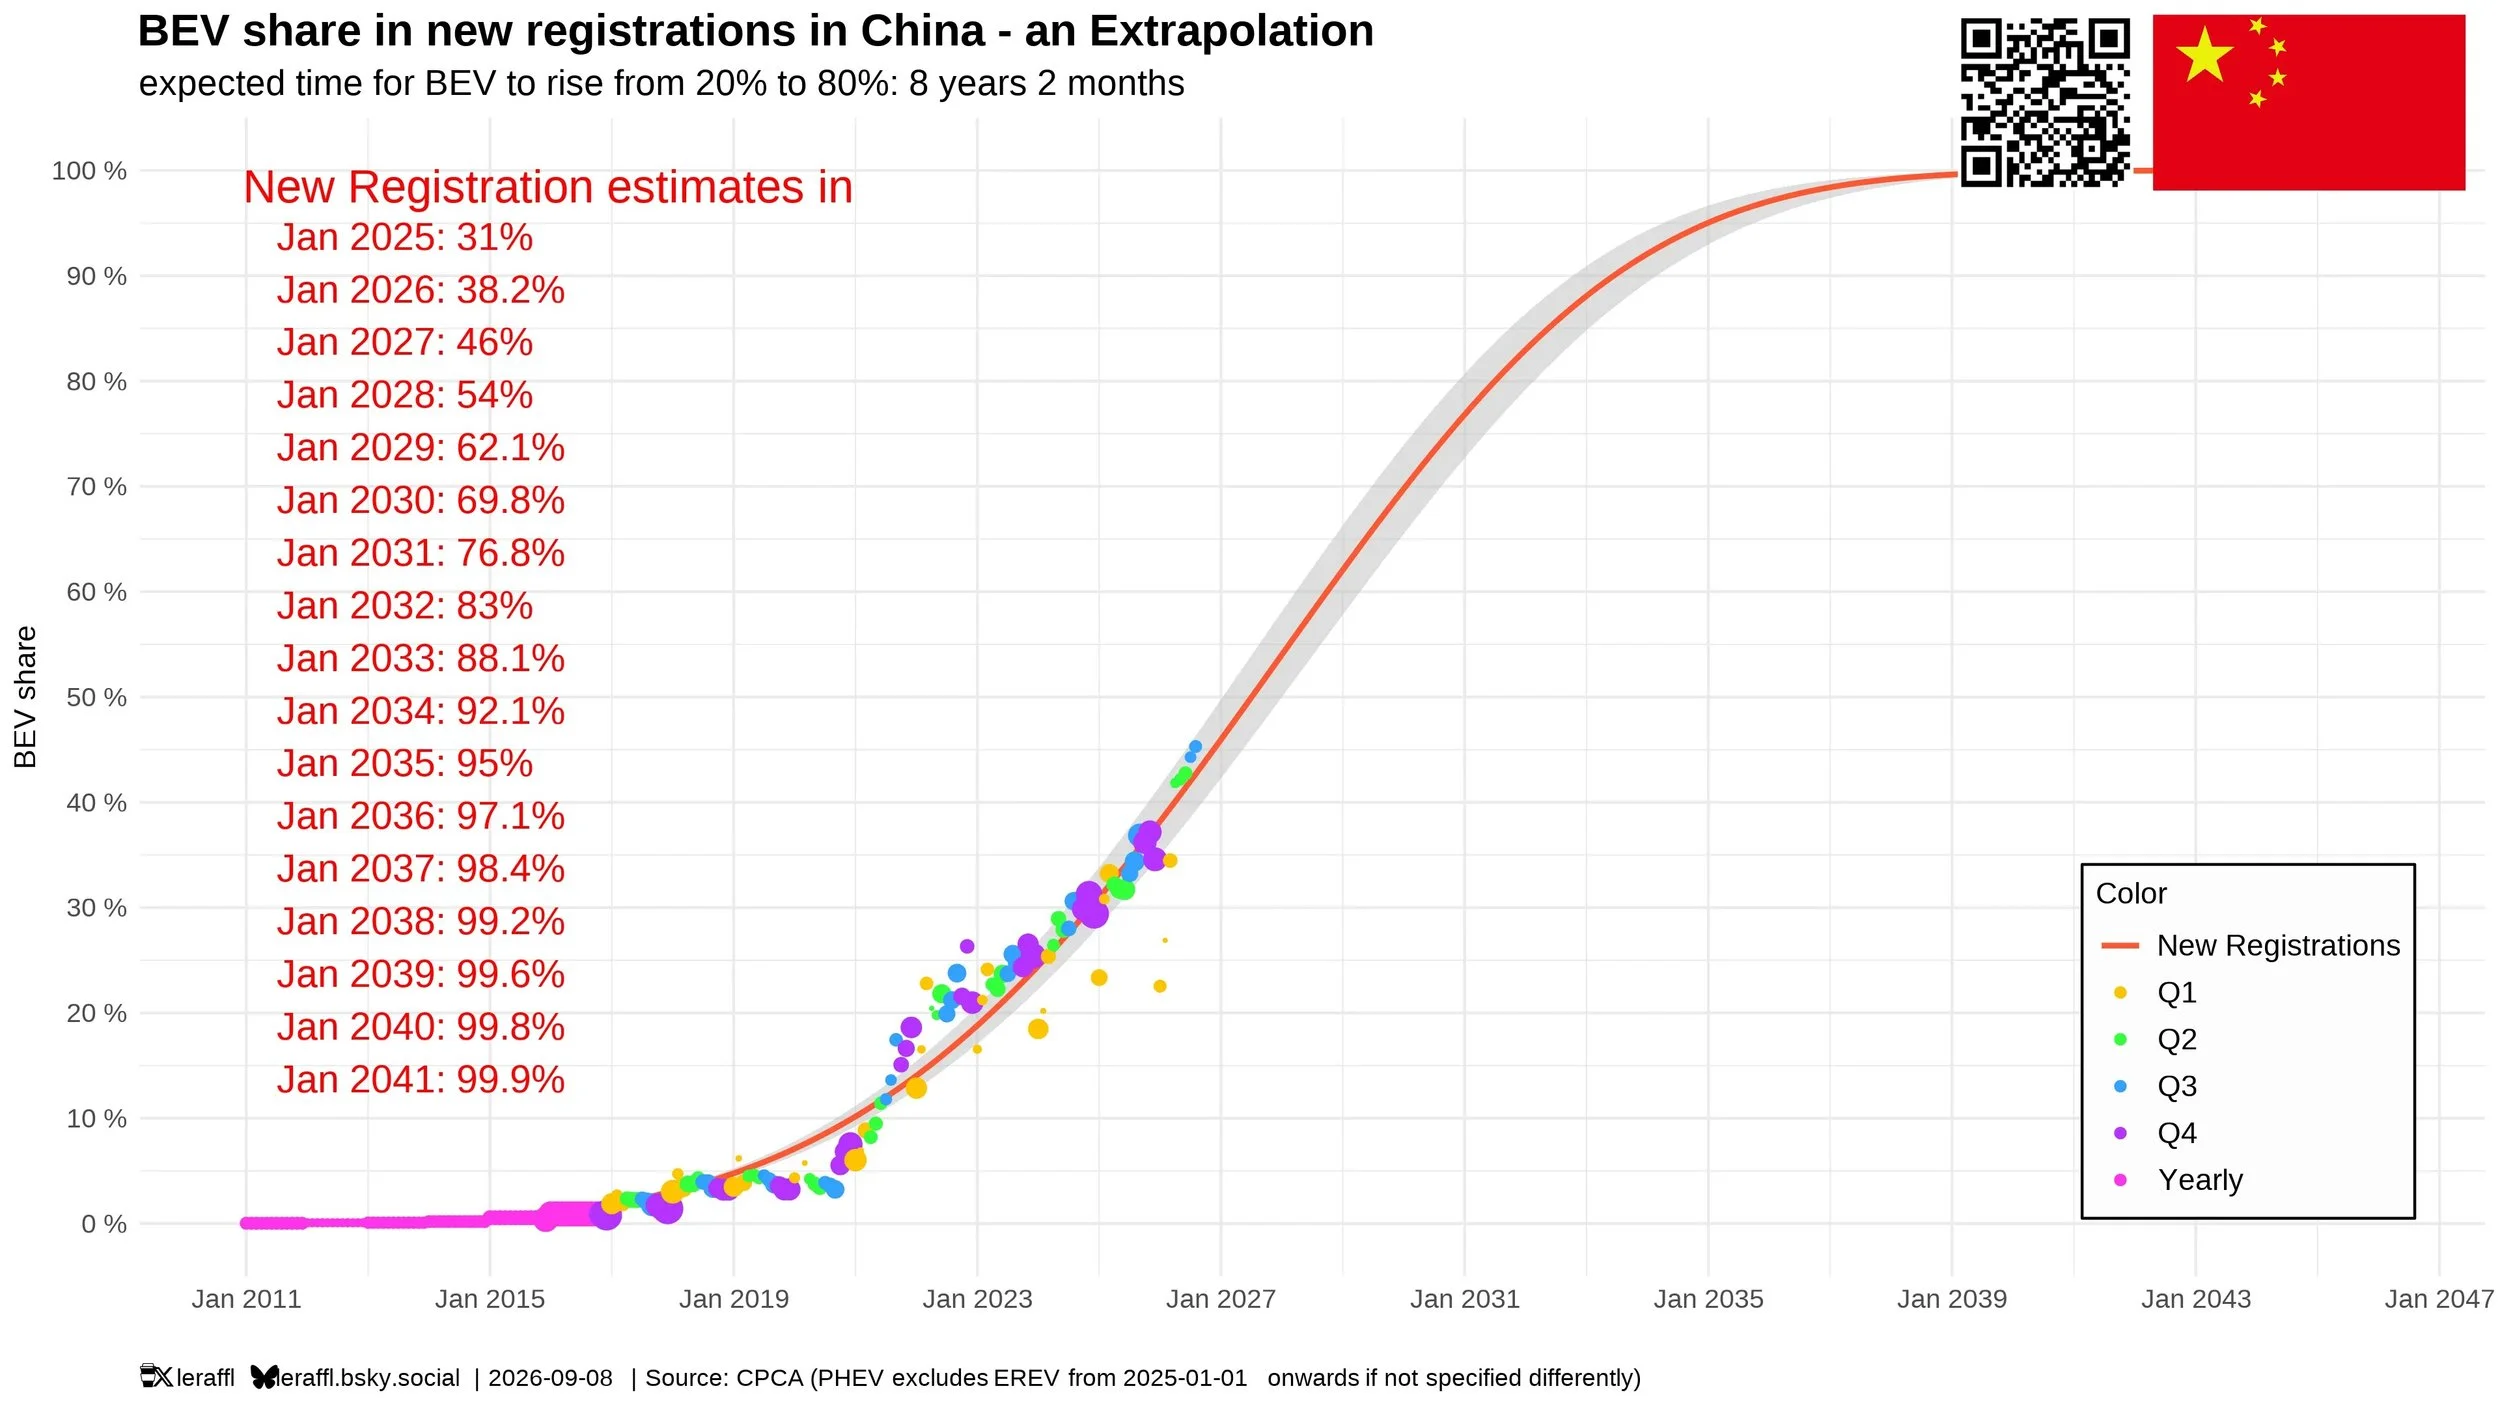
Extrapolating the adoption curve, as shown below, implies that BEVs are on track to exceed 50% of annual sales in around 3Q27, meaning 2027 could be the first full calendar year of majority BEV sales. A research analyst at Sinopec, one of China’s major state owned oil companies, is even more bullish, projecting BEV adoption to reach 80% by 2030. The direction of travel is already clear, but if oil and refined products prices stay high, such an accelerated transition pathway will be more likely. This points to the eventual outcome for other markets too.
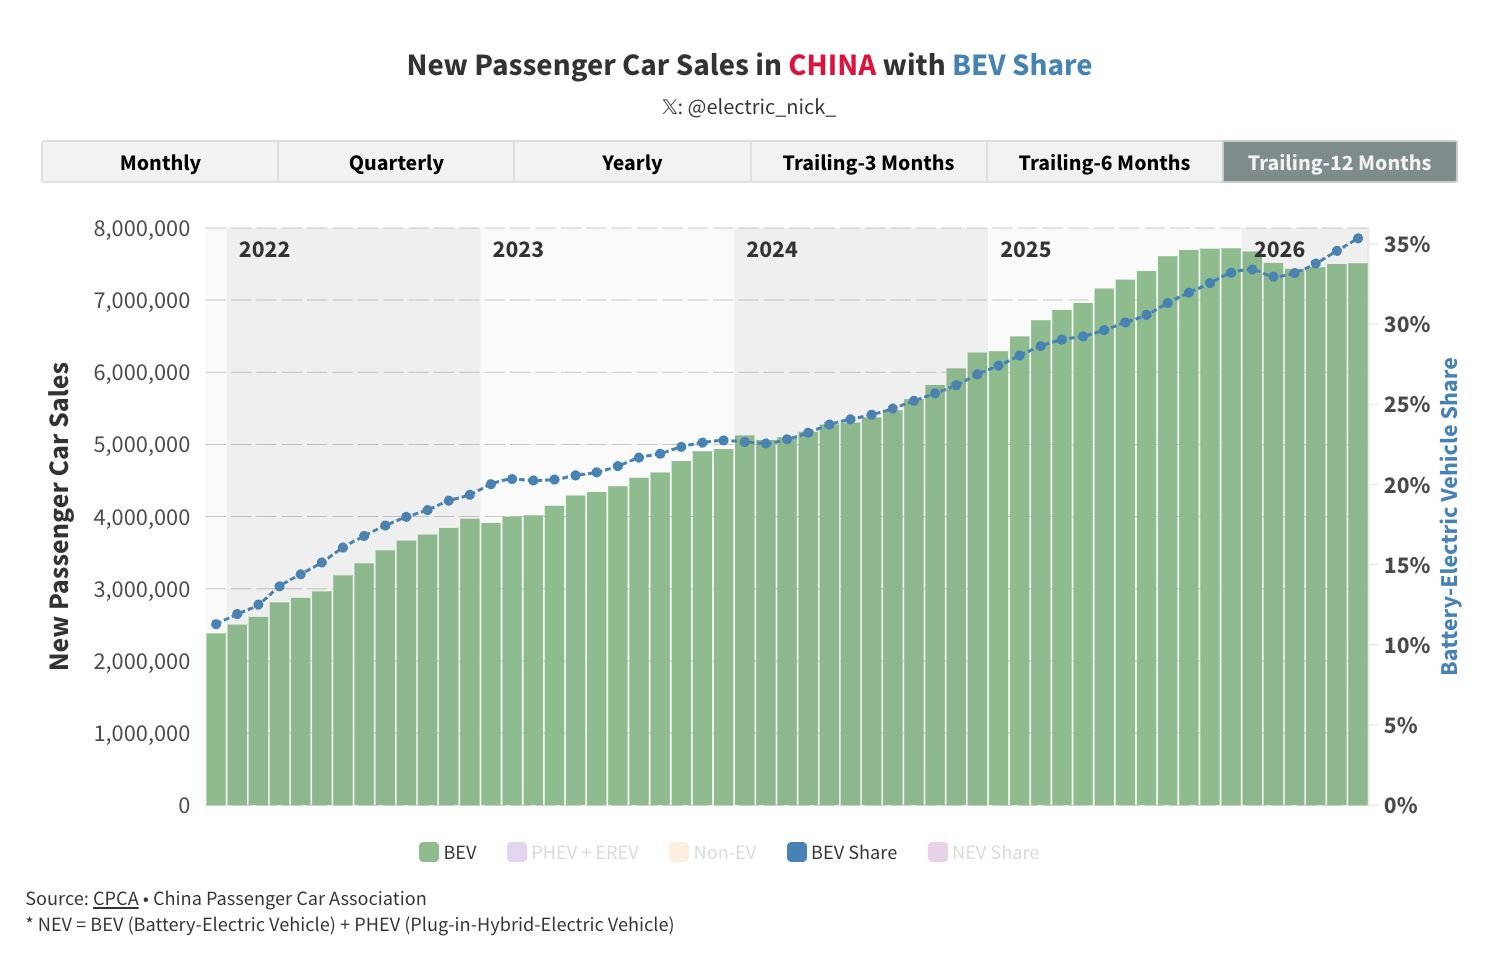
BEV share in China - actual and extrapolated. Source: CPCA, via LeRaffl
None of this is surprising when electricity is relatively cheap compared to gasoline in China. Choosing a BEV over an ICE car exposed to high and volatile gasoline or diesel prices is simply the rational economic choice. There is of course a big national economic and energy security angle here. With no real end in sight to the Persian Gulf and Russia-Ukraine quagmires, China is naturally seeking to reduce dependence on foreign oil imports as fast as possible, not just for cars but for buses, trucks and commercial vehicles across ports, freight, industrial sites, construction sites, mines and so on. Hitting its national target of 30% NEVs in the fleet by 2030 (from 12% in 2025) will require a 90% NEV market share by that year, which now looks plausible. Sinopec now believes Chinese oil demand peaked in 2025 and will decline by as much as 600,000 bbl/d, or nearly 9%, in 2026. This is already a big number but as China’s stock of ICE vehicles likely peaked in 2025, it can only increase over time.
The pace of change is already remarkable. As recently as January 2026, there were still seven ICE vehicles in China’s monthly top ten best-selling car models. Now there are none. (Three of this list are BYD models: #4, #5 and #9).
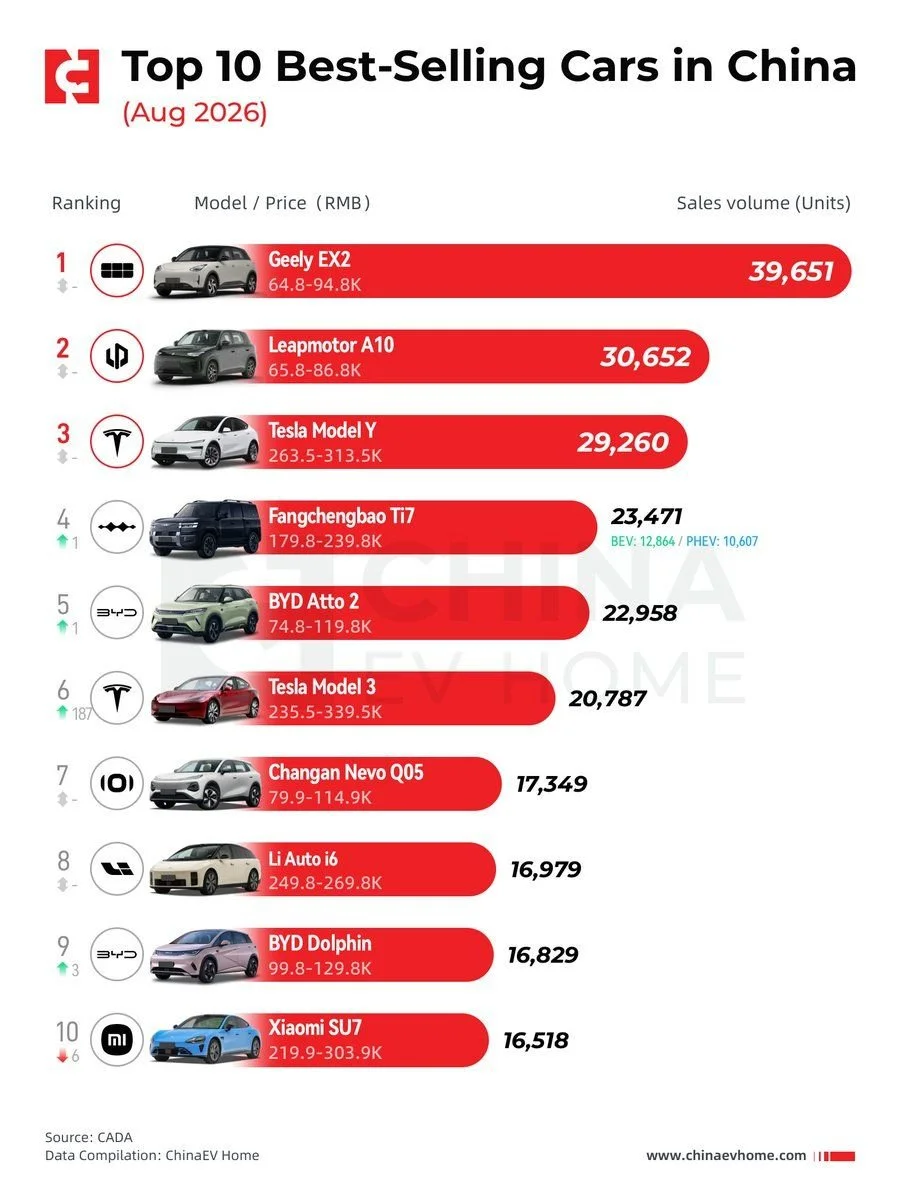
Top 10 best-selling cars in China, August 2026. Source: CADA via Chinaevhome.com
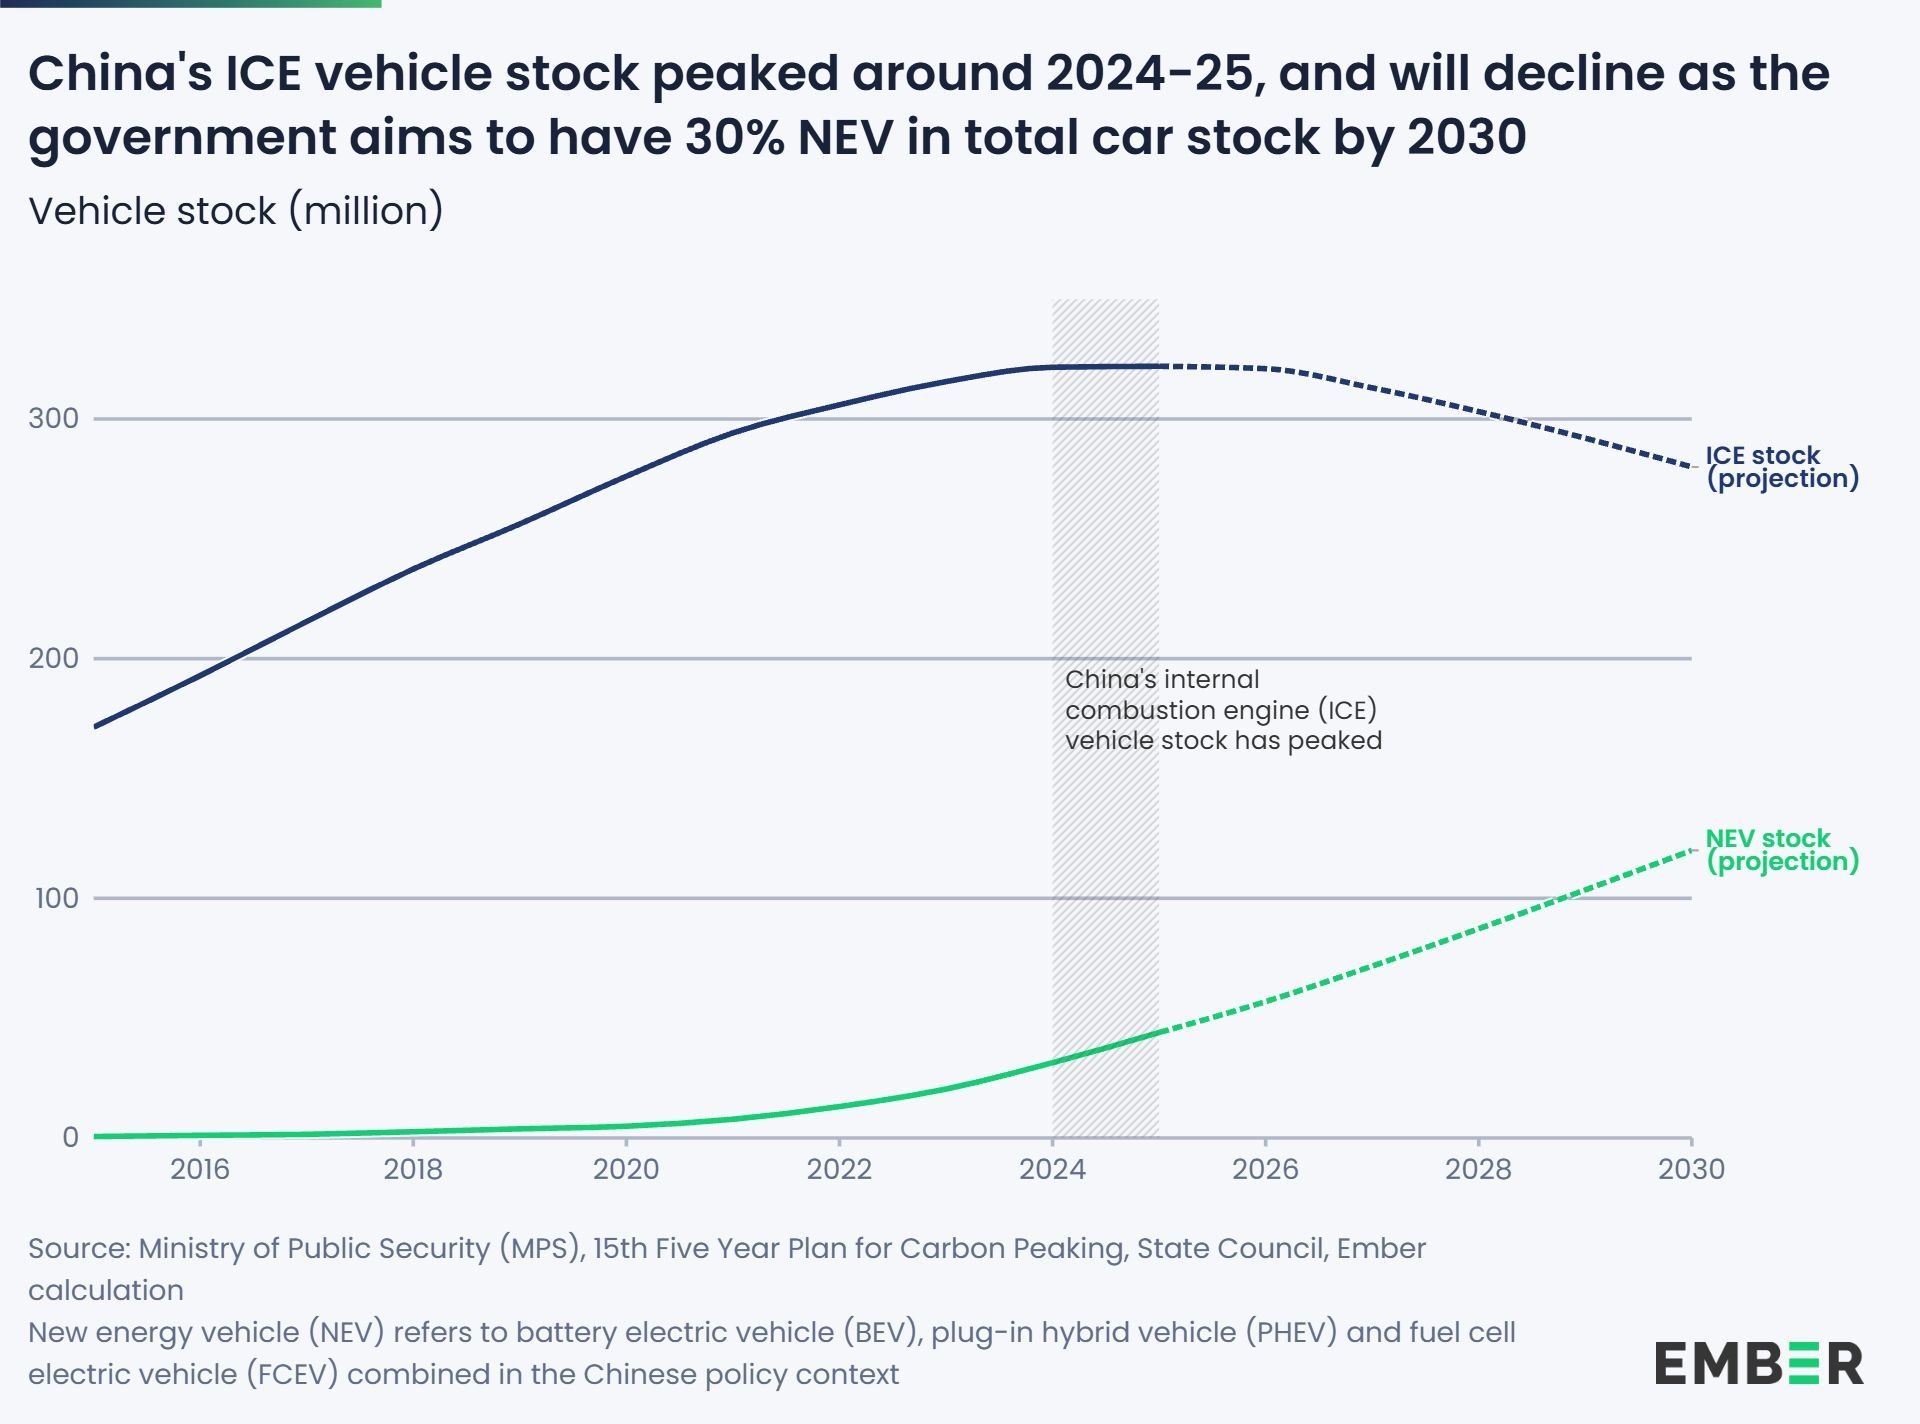
Chinese ICE fleet peaks as NEV fleet rises. Source: Ember
As the world’s largest car market, nearly double the size of the US, China has been a big growth engine for major European and US car manufacturers. Now, however, they are now disproportionately losing out there to more powerful, high-tech new models offered by local brands. Despite tariff protection in home markets, that applies across international developing markets too.
Even so, intense domestic competition means Chinese EV OEMs can take nothing for granted either. Profitability remains under real pressure. Many have already gone under and others have been running unsustainable negative margins. Even the biggest and most financially robust are not immune, although they may also see potential consolidation opportunities.
The good news: global EV markets
If profitability in China has become more challenging, then the key to surviving - and ideally thriving - will be access to the many fast growing international markets, where BEV demand still remains relatively untapped. In Europe, EV poster children Norway and Denmark are the furthest up their adoption curves at 98% and 80%. But they are also very small, at less than 1% each of China’s population. The significance of these Scandinavian markets isn’t so much their size as their proof of concept, demonstrating that a full transition is possible.
But Europe is no longer just a story of progressive Scandinavians. Across the whole oil-import dependent continent, electrification is an urgent strategic priority as the key to greater energy security and economic resilience. Demand is changing fast across the region: French monthly sales of BEV alone (not NEVs) has just reached a record 38% of total sales, with Germany hitting 32% and the UK 30%. Currently, the EU charges up to 35% tariffs on imported BEVs on top of its standard 10% import tariff rate, but not on imported PHEVs, inflating demand for the latter. That distinction is expected to change within the next year. To overcome trade barriers, Chinese OEMs are investing both in joint-ventures with European OEMs and ultimately in their own plants within the EU, giving direct access to key markets.
Meanwhile in Australia, NEVs have just overtaken ICE sales - and they won’t look back. In just a single year from July 2025 to July 2026, monthly sales of BEVs in particular have tripled, both in absolute terms and market share, reaching 33,869 or 32% of the market. As for the US, the world’s second largest car market, protectionist measures have locked Chinese OEMs out for the foreseeable, but any future policy change under a new administration there could unlock significant further upside.
Ultimately, however, the international prize will not lie so much in richer countries naturally biased towards their own long-established manufacturers as in upwardly-mobile demographics in “emerging market and developing economies” (EMDEs) across Asia, Middle East, Latin America and Africa. BYD is well positioned to tap into rising EV adoption rates across such lower to middle income countries from Malaysia, Indonesia and Pakistan to Brazil, Mexico and Colombia, plus too many others in between to mention. Individually, none can remotely compare to China in scale, but collectively they have the potential to more than compensate financially for slower domestic growth. Even as adoption takes off in key Latin American markets as shown in the chart below, total market share still remains below 10%, leaving considerable further upside. Big markets like India are still very early in their adoption curve. NEV shares are doubling in several other emerging markets, but likewise still have far to go before reaching majority shares, let alone turning over actual fleets.
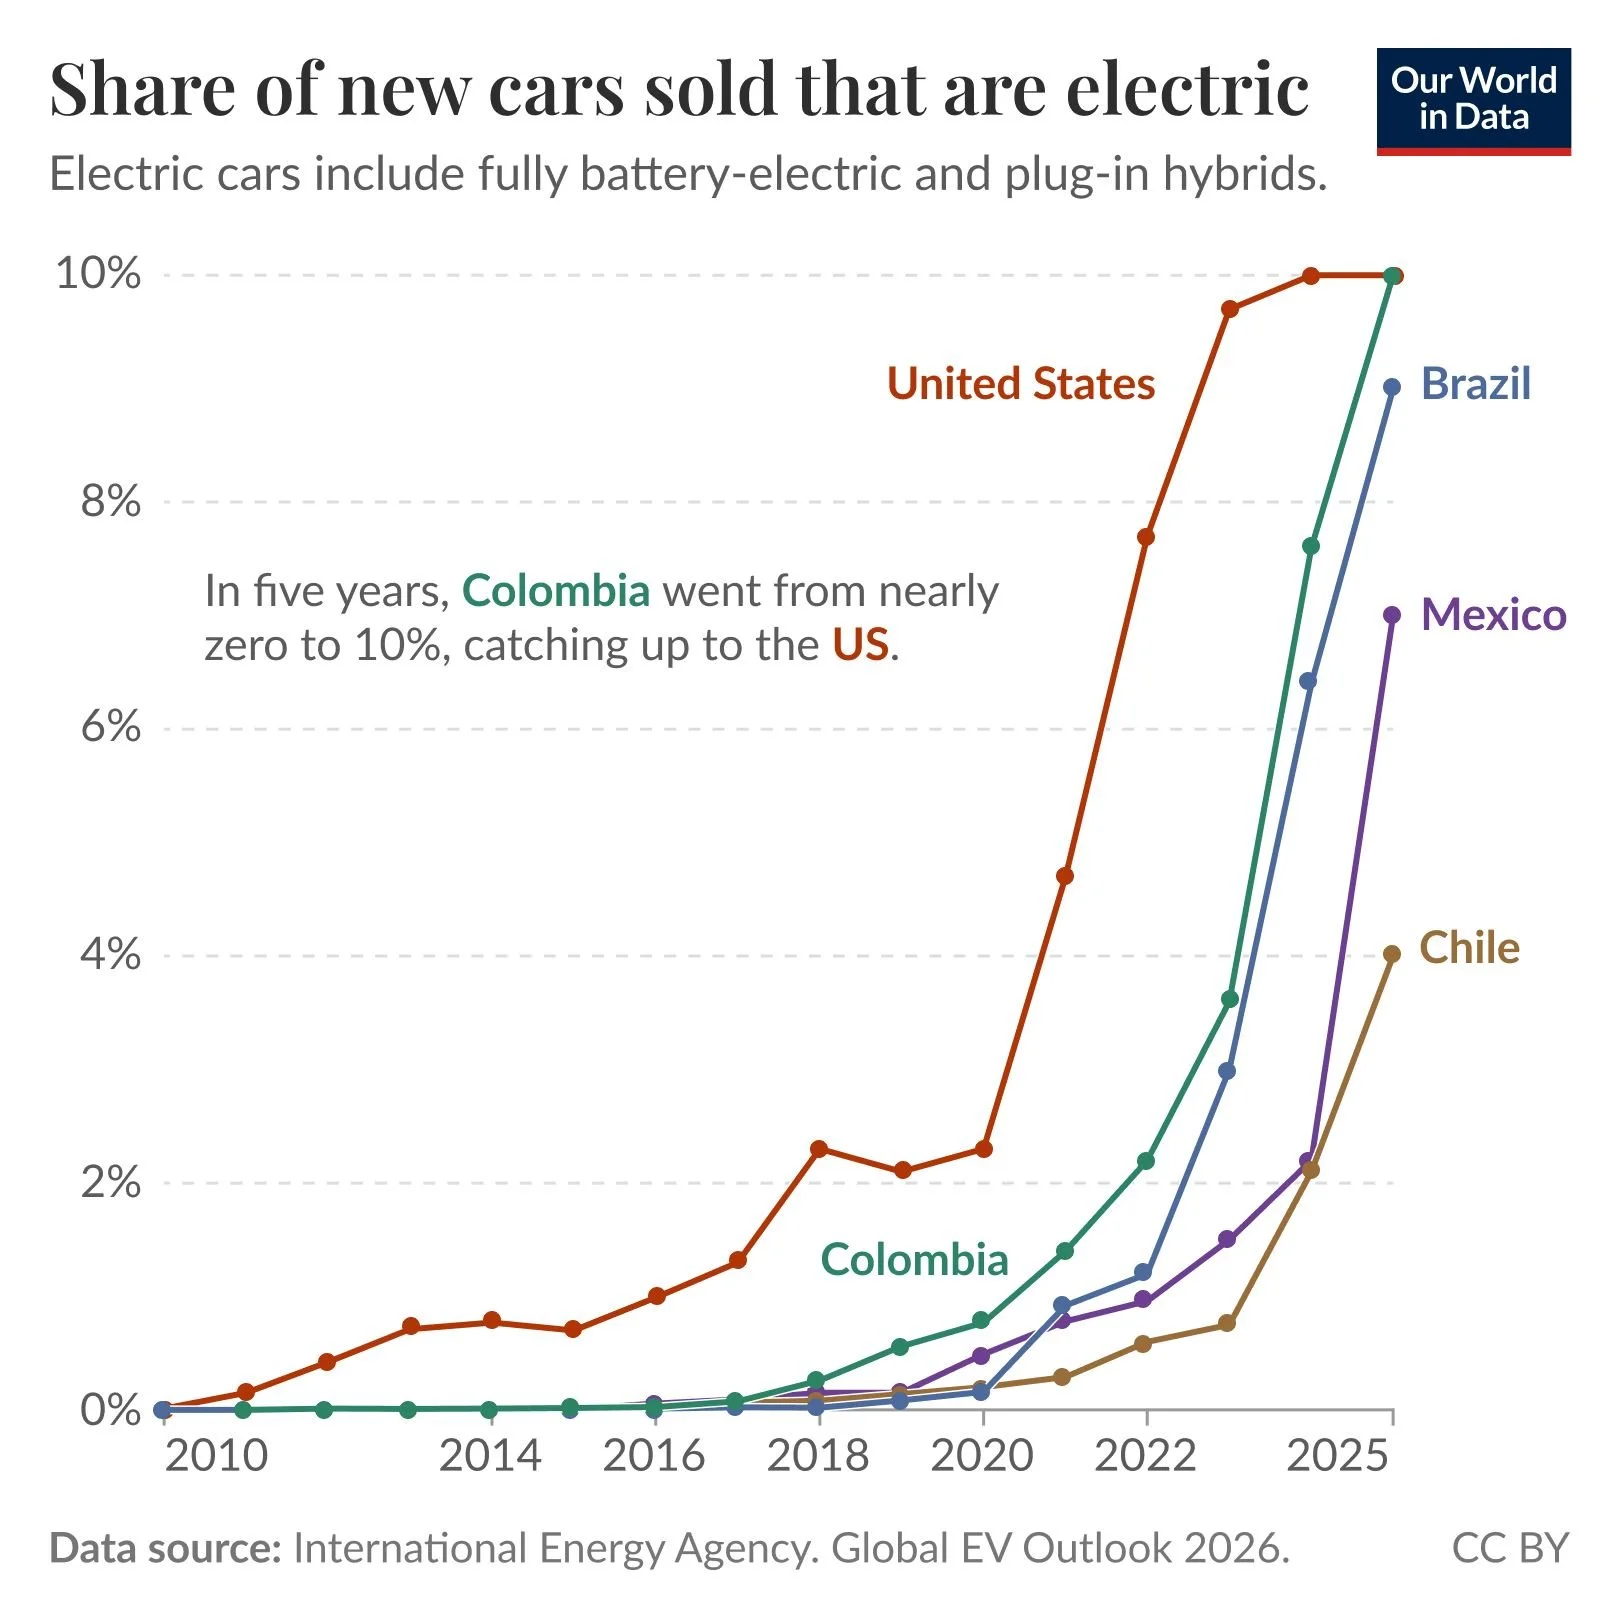
Selected markets share of NEVs. Source: Our World in Data
Taken together, these “rest-of-world” markets will represent the tailwind of global NEV demand, offsetting the structural decline in ICE sales. The trend is clearly boosted by far higher crude and refined products prices, but the underlying direction will likely continue even if peace suddenly breaks out across the Middle East and Ukraine. As range extends, costs decline and charging infrastructure expands, enhancing convenience and pulling down total cost of ownership, NEVs - and BEVs in particular - fall ever more within reach of average buyers in these markets.
For EMDE populations, affordability really matters, both in up-front and running costs. They can least afford exposure to high oil prices and so have the strongest incentives to go electric, especially if local incentives support it. Outside of the heavily protected US and European markets, Chinese imports have risen from 10% of EV sales in 2021 to 55% in 2025. From 2023 to 2025, BYD’s market share across Africa flew from 4% to 35%, and is now over 80% in some individual countries.
If the race is now on to meet this demand, then Chinese OEMs are answering the call. Over 1H26, Chinese NEV exports grew by over 120% to nearly 2.5 million units. China still exports plenty of ICE cars too, but NEVs share of total exports has already risen to more than half.
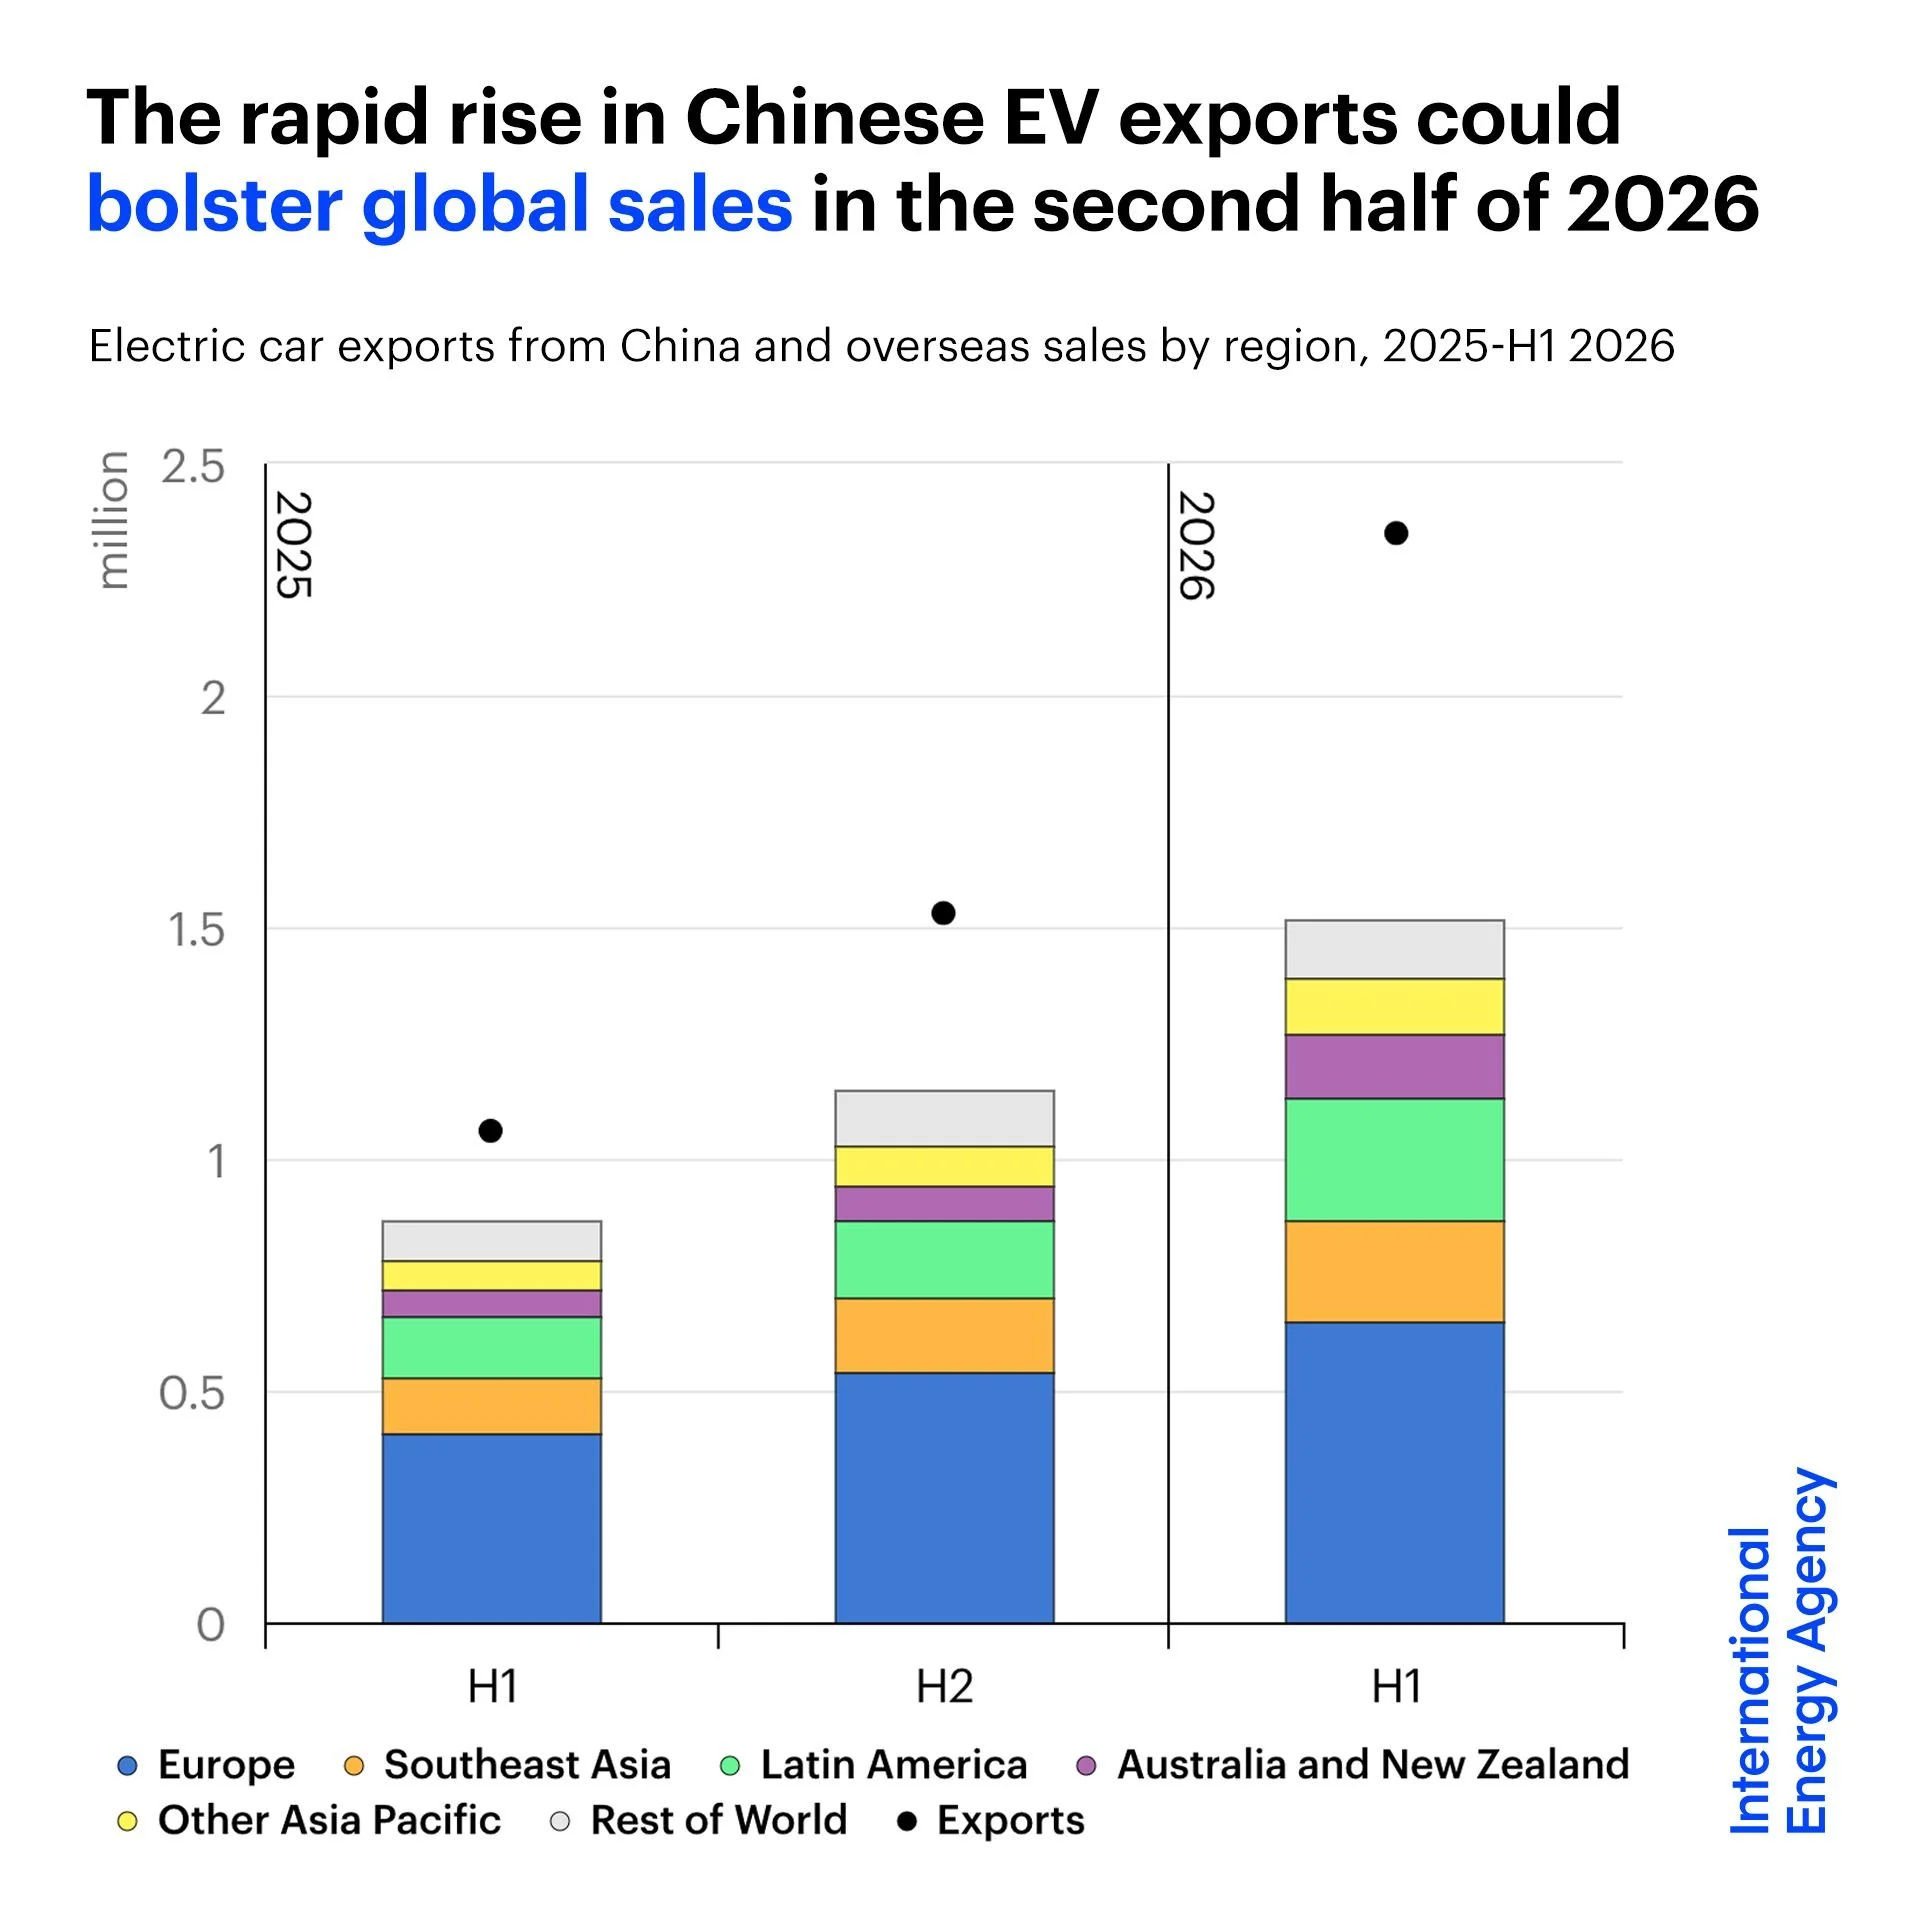
Chinese NEV exports 1H25-1H26. Source: IEA
These are exciting figures, but with NEVs in total still barely 5% of the cars on the road today, the vast majority of global NEV sales are yet to come. The mobile battery revolution is still only just getting started.
BYD: From domestic heavyweight to global behemoth
It will come as no surprise by now that BYD’s centre of gravity is shifting decisively both from China to international and from PHEVs to BEVs. The company latest half-year report makes no secret of this pivot:
"China's automotive industry entered a stage of profound adjustment and divergence characterized by 'sluggish domestic demand and robust export growth… The group's overseas growth momentum will continue to be unleashed."
The shift is already clear in sales numbers. Domestic sales fell 33% to 1.51 million vehicles over January-August. But rising international sales restricted the overall sales decline to 2.67 million, only 7% down. Monthly trends suggest the worst may be now behind it. Both Chinese and international monthly sales have grown every month since bottoming out in February (January and February are typically the weakests months of the year for car sales).
As the chart below shows, after peaking in 4Q24, BYD’s domestic sales were fairly flat in 2025 before hitting a new low below 100,000 in February 2026. They have since rebounded steadily to 243,918 in August. This is still a long way short of November 2024’s record of 473,026, which looks still well out of reach. But despite intense competition, BYD has retained its leading market share of Chinese BEV sales, both domestically (23.3%) and for exports (35.4%).
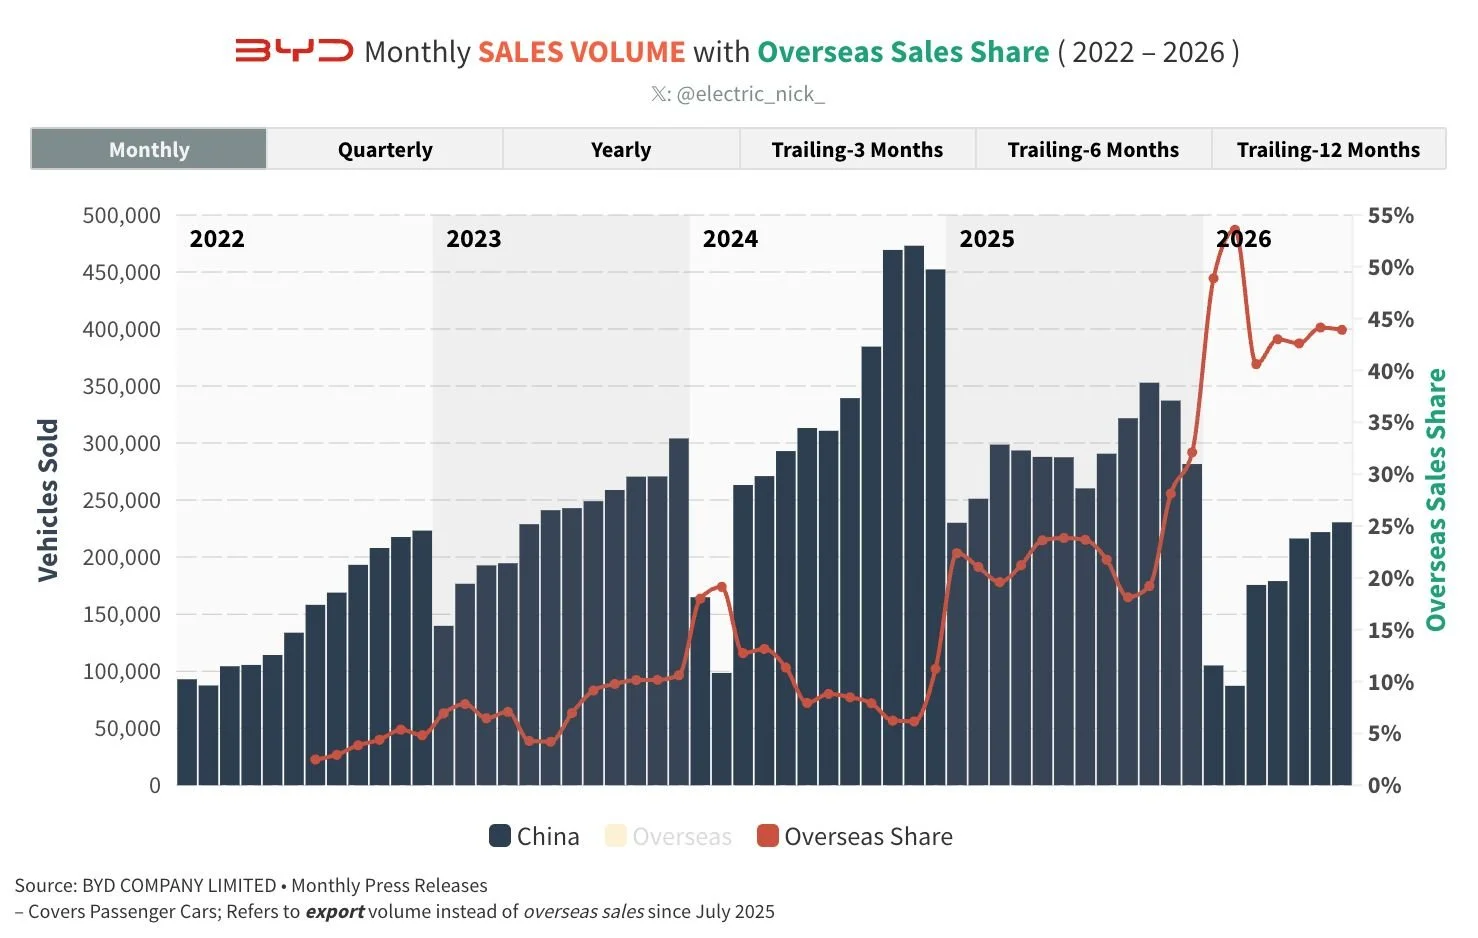
BYD domestic sales by month. Source: BYD via Electric Nick
The attributes that have enabled BYD to succeed in a hyper-competitive Chinese market - scale, vertical integration, technology leadership and distribution capacity - now position it very well to lead the wider global competition. International sales are rising fast. In August 2026, it sold ~190,000 vehicles overseas, more than double the ~81,000 in August 2025 and more than 5x the ~31,000 of August 2024. That represents 44% of its total monthly sales, versus 22% a year earlier. This share looks highly likely to keep rising as international market growth outpaces China. Over the past 12 months, BYD has sold nearly 1.6 million cars outside of China, quadrupled the 400,000 of only two years ago.

BYD international sales and share, rolling 12-month basis. Source: BYD via Electric Nick
But it’s not just a volume game. International markets have a crucial attraction: the same car can command a much higher price. Each international sale makes on average ~$3k in net profit, up to 3-4x what it makes per car in China. The Seal hybrid SUV costs €40,000 in Germany, more than double the Chinese sticker price. Higher international sales underpin overall profitability.
In Europe (including UK), BYD has grown from almost nowhere two years ago to selling an aggregate of over 90,000 cars in 2Q26. And the numbers keep rising: in August 2026, BYD’s UK sales doubled year-on-year to over 48,000.

BYD quarterly European sales. Source: BYD via Electric Nick
BYD’s export markets are also well diversified. In 1H26, Brazil was the biggest at nearly 100,000 vehicles, followed by Australia and the UK, which collectively accounted for another ~90,000. The next 7 largest were Italy, Germany, Thailand, Indonesia, Spain, Philippines and France. In most of those markets sales more than doubled, albeit total volumes in each case were below 30,000.
These international sales are now starting to show up in BYD’s financials. In 1H26, with 44% of international sales, international revenues overtook domestic revenues for the first time at CNY 181.3bn or 53% of the total. In fact, roughly one third of BYD’s total revenues shifted from domestic to international over that period alone. That helped net income rise for the first time in over a year.
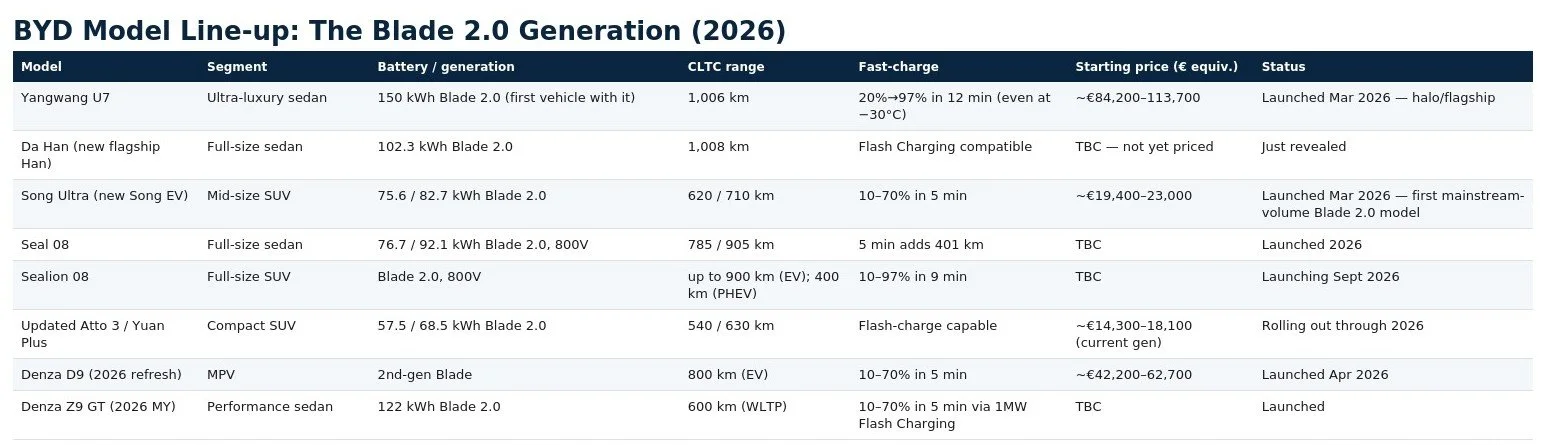
Fulfilling the potential for much higher international sales has naturally requires much new investment. A key challenge has been retooling from its first-generation to second-generation Blade (2.0) battery, which promises a quantum leap in range to over 1000km ultra-fast charging times (10% to 97% in 9 minutes). This process has hindered the rollout of newer, much more competitive models like the Denza Z9 GT, Yangwang U7 and the AT3 EVO, creating an estimated backlog of 250,000 vehicles. By the same token, completing this transition over the next half-year should help to unlock higher sales going forward.
Then there is getting those new models to markets. BYD already boasts an impressive container ship fleet of 8 roll-on/roll-off (RoRo) car carrier vessels with capacity of up to 9,200 cars per ship, but this has still been a bottleneck. Clearly, this is also a good problem to have as unlocking it can support higher growth. That’s why BYD has just ordered 10 more RoRo ships, expanding the fleet to 18 in total over 2027-29, with an expected capacity of 130,000 cars at any one time.
Perhaps even more importantly, BYD’s international expansion strategy also requires establishing its own factories to build and sell cars directly in fast-growing global markets. It already has plants up and running in Brazil (150,000 vehicle/pa capacity rising potentially to 600,000), Indonesia, Thailand and Kazakhstan. Its Hungarian plant, a key strategic footprint in Europe, is expected online by year end. Then there are plants in Mexico, Malaysia, Pakistan and Vietnam to follow, no doubt not the last.
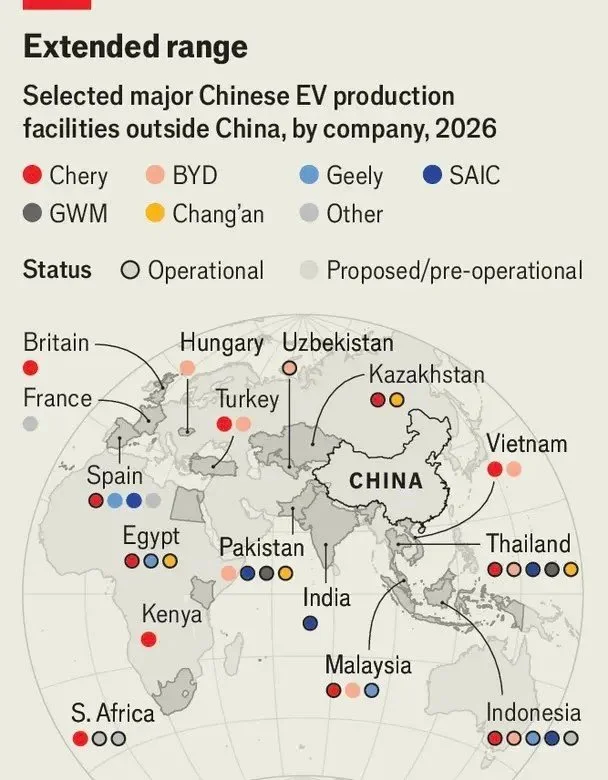
International plants of selected Chinese EV OEMs. Source: The Economist
As new investment expands overseas factories and shipping capacity, BYD’s sales will continue to trend international. Those higher volumes and higher margins should in turn support robust revenue and income over the next few quarters and beyond, if a global oversupply can be avoided. That recovery appears to have started by 2Q26 when net income rebounded by 34% to CNY 8.2bn.
From hybrid to full electric
Across all markets, BYD’s annual sales volumes are currently fairly evenly split between PHEVs and BEVs.
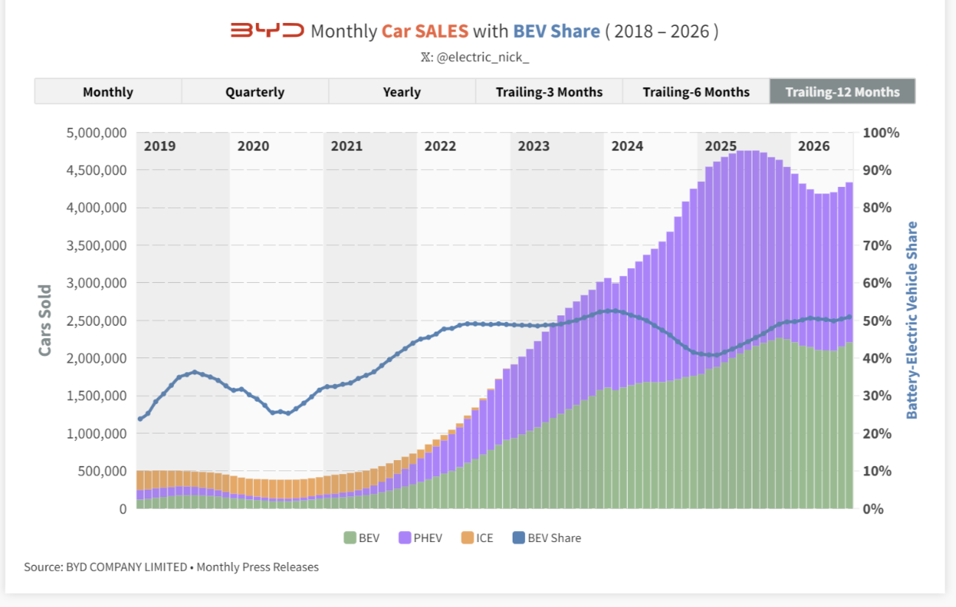
BYD sales split by drivetrain, trailing 12-month view. Source: BYD via Electric Nick
However, that balance is also shifting towards BEVs. PHEV monthly sales peaked in late 2024, and on a trailing 12-month view have been fairly stable since. By contrast, BYD’s monthly BEV sales just hit a new high in August 2026, reaching ~60% share of the total. After a slow start to 2026, BYD’s BEV sales are now on track to overtake its 2025 BEV sales this autumn and very likely end the year higher.
Sales targets
With a weaker market in China, BYD’s overall sales have levelled off recently after years of rapid growth. From 1.86m in 2022, they reached 3.01m in 2023 and 4.25m in 2024, before slowing down to 4.54 in 2025. This year is now on track to end up roughly level with 2025 and in revenue terms we expect 2H26 will likely compensate for the 7% drop in 1H26. 3Q26 data provide scope for grounded optimism: July sales grew 22% year-on-year and August was BYD's best month of 2026, with 440,293 NEVs sold, up 17.8% on August 2025, That was its fourth straight month of year-on-year growth after eight months of decline.
As capital investments pay off, management now sound much more bullish about the future. The Blade 2.0 upgrade puts BYD back on the front foot both domestically and for international market share. Stella Li, BYD’s top international executive, recently told the FT that BYD plans to show the world “how innovation, performance, premium design and sustainability can coexist within one of the most comprehensive automotive portfolios in the world”. Initial guidance for 1.3 million international sales in 2026 has been revised up by around 50% to nearly 2.0 million - with over 2.5 million projected for 2027.
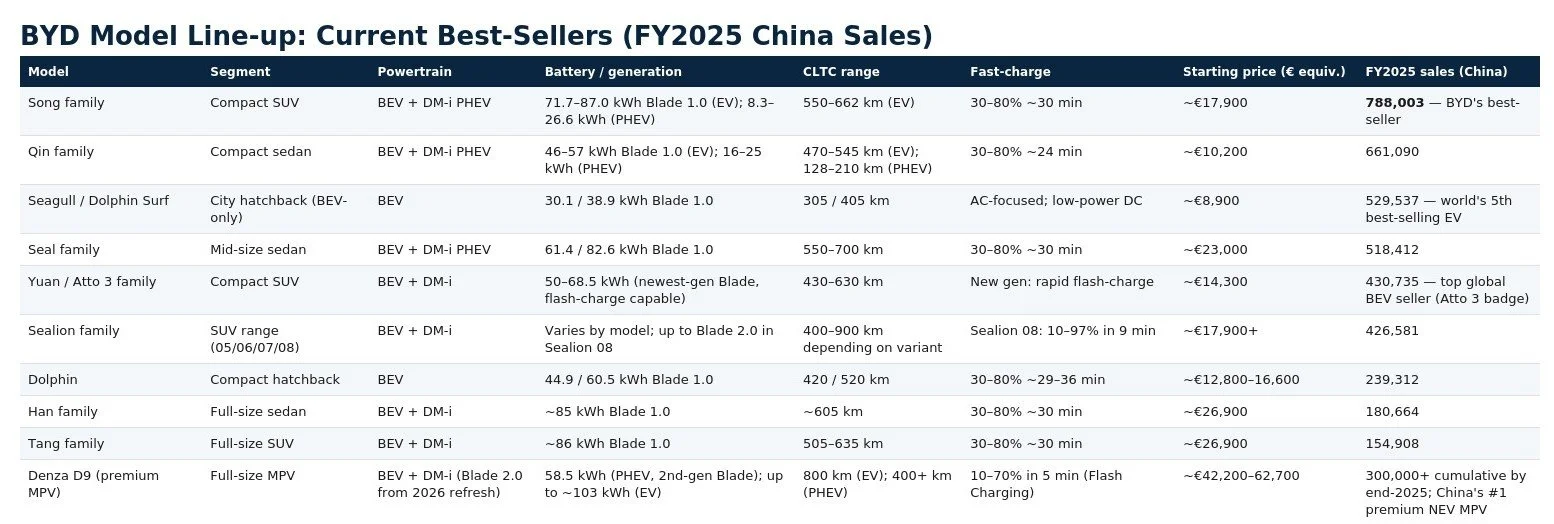
BYD is betting big on new models to hit these targets. First generation Blade battery models typically offered a range of up to 500-700 km with charging times of around half an hour. Big sellers include the Song, Qin, Seagull, Seal, Sealion and Atto ranges. But the Blade 2.0 battery raises the stakes considerably. With 1000 km range, charging times under 10 minutes, floating infotainment screens front and back, zero gravity seats and even built-in fridges, all at competitive prices, BYD has significantly enhanced its proposition to the next generation of drivers. The shift towards higher value brands and models is a key strategy to offset price and margin pressure.
Flash charging
The other key to higher sales is the rollout of flash charging infrastructure. To support the appeal of Blade 2.0 models, BYD is aiming to roll out 20,000 flash-charging stations in China this year, a further 30,000 in 2027 and 40,000 in 2028. Outside of China it is aiming for another 6,000, half of which are to be in Europe. This can also provide charging revenue in its own right.
The arrival of flash-charging is designed to break another key barrier to BEV adoption: the perception of slow charging times. Matching the refuelling turnaround time of ICE vehicles - perhaps their last remaining advantage - is another decisive step in creating a superior driving experience and thereby opening up the whole market. Much longer Blade 2.0 range also simply reduces the need for frequent charging.
Unsurprisingly, sales data suggests that the combination of longer range, faster and more ubiquitous charging, semi- and fully autonomous driving features and high-tech interfaces is starting to particularly attract younger, smartphone-generation drivers.
Batteries on wheels
It’s also worth remembering that BYD is also much more than just a car manufacturer, for two reasons. First, it made batteries before it ever made cars. Behind global leader CATL, it is very well established as the world’s second largest battery manufacturer, well ahead of the rest of the field. BYD therefore offers investors exposure to the tailwinds in the global battery energy storage system (BESS) space, as covered in detail in the first of these two battery focused editions, Edition 22 on the BESS market and CATL. It has delivered large storage projects in well over 100 countries and regions. Second, if it can put wheels on batteries, then that applies to not just cars but also larger commercial vehicles, buses and trucks, among other formats.
The competition is also on the charge
Of course, BYD is far from the only manufacturer with ambitions to dominate electric transport. Even if the global EV market does double to ~40m by 2030 and triple to ~65m by 2035, the race to win over cost-conscious buyers will remain highly competitive. Tesla sales are also showing signs of recovery after a flat couple of years. Major Chinese manufacturers like Geely, SAIC, Leapmotor, Chery and Changan are all determined not to be left behind, bringing hot new models all the time. The obvious risk is that all these manufacturers end up like Chinese solar OEMs, with too much supply chasing demand that struggles to ever catch up. A perpetual race to the bottom in international markets would hit longer-term profit margins. And if anything shows how fast-paced and brutally competitive the Chinese car industry really is, it’s the fact that a consumer tech firm like Xiaomi with no history of carmaking managed to bring highly desirable EVs, the SU7 and YU7, to market within barely two years. Other up and coming challengers include Vietnam’s Vinfast, which is growing fast in south-east Asia.
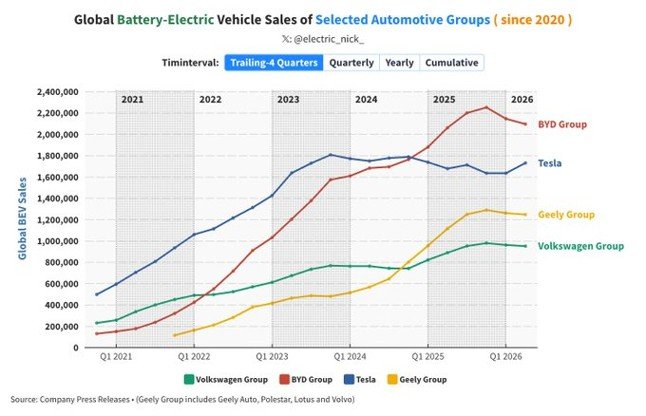
2021-1H26 BEV sales for 4 top OEMs: BYD, Tesla, Geely, VW. Source: Electric Nick
Financial Performance
BYD’s operating and net profit margins peaked in 2024, when the Chinese BEV and PHEV markets were growing faster. By 2025, BYD’s size and market share made it particularly vulnerable to the domestic price war. Revenues of just over CNY 800bn were 3.5% up on 2024, but operating margin fell from 6.4% to 4.2% and net margin from 5.2% to 4.0%. By contrast, its key rival Geely’s adjusted gross and net margins improved by 70 basis points in 2025.
The latest profitability metrics may just reflect usual seasonal effects, or possibly that the worst effects of the domestic price war may be over. BYD’s net margin declined through 3Q25-4Q25 before plunging to a trough of 2.7% in 1Q26, particularly affected by a spike in FX expenses. It then rebounded strongly to 4.2% in 2Q26, while the gross margin held near cycle highs of 18.9%. By that second quarter, margins appeared to be recovering ahead of the top line, with net profit rebounding by 34% year-on-year.
Capex and free cash flow (FCF) levels have shifted considerably with the Blade 2.0 investment and international plant build-out. Capex rose over 60% in 2025 to a record CNY 157bn. Operating cash flow fell by more than half to CNY 59bn, pushing FCF to just under CNY -100bn: the first negative number since 2019. This in turn increased balance sheet leverage for the first time in a decade. By mid-2026, BYD went from net cash to a marginal net debt position (~0.1x).
Overall, these figures reflect the strategic narrative: having established a strong domestic position, over 2025-26 BYD has been investing its cash reserves in the strategic pivot from a national champion into an international powerhouse, to launch the next decade of growth. International markets are the ultimate prize. The recovery from 1Q26 to 2Q26 - and subsequent sales data in Q3 to date - provide some early data points indicating that strategy is now starting to bear fruit.
In terms of trading multiples, BYD’s share price normalised from an ultra-high growth 240x trailing price/earning (P/E) ratio in 2021 to ~19x by 2023-24, as earnings caught up. The ratio then rebounded to ~26x even as earnings fell amid tougher domestic trading conditions in 2025, before 2026 share price weakness has brought it back to ~21x.
By contrast, EV/EBITDA has been more stable, remaining within a tight 6.7-7.1x band over 2023-25 before falling to 5.9x currently. EBITDA has proven more resilient than implied by the faltering share price, albeit much of it is being consumed by reinvestment rather than flowing through to free cash flow. This gap should close as the capex cycle matures, but is worth monitoring.
Relative Share Price Performance
Over the first half of 2026, BYD shares (Hong Kong listing) fell from HKD ~95 to a low of HKD 72.45 by 30 June. They then briefly recovered to HKD ~90 range, before falling again to just under 20% down year-to-date at the time of writing in early-mid September 2026:
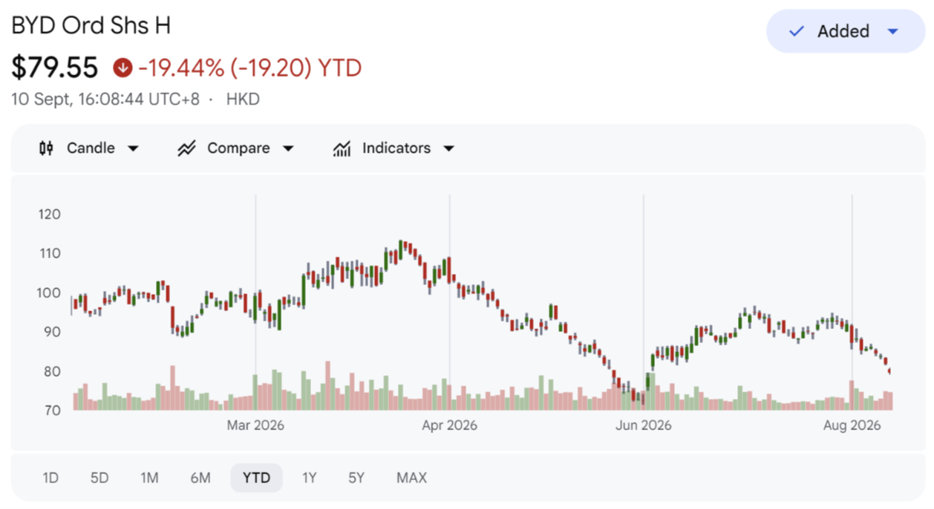
BYD (HK listing) share price performance YTD to 10 Sept 2026. Source: Google
But this disappointing 2026 performance is evident across its Chinese peer group, reflecting the broader Chinese market dynamics. As the chart below shows, BYD (blue line) and competitors like Geely, SAIC, Chery and Great Wall Motor are all in negative territory for the year.
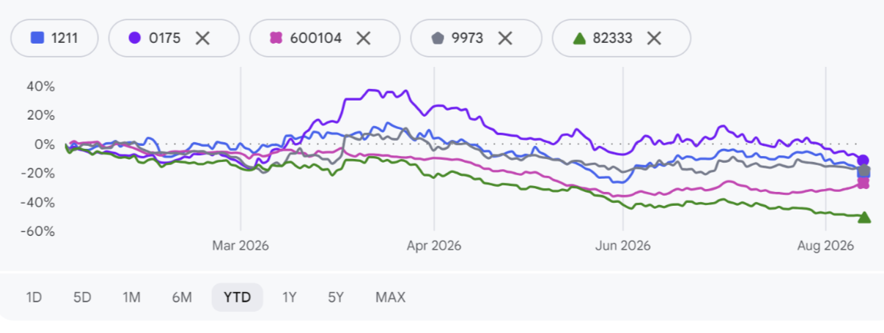
BYD vs selected Chinese EV OEMs, YTD to 10 Sept 2026. Source: Google
Against the global competition, BYD shares have fallen by a similar level as VW and Tesla year to date, with Toyota only marginally better.
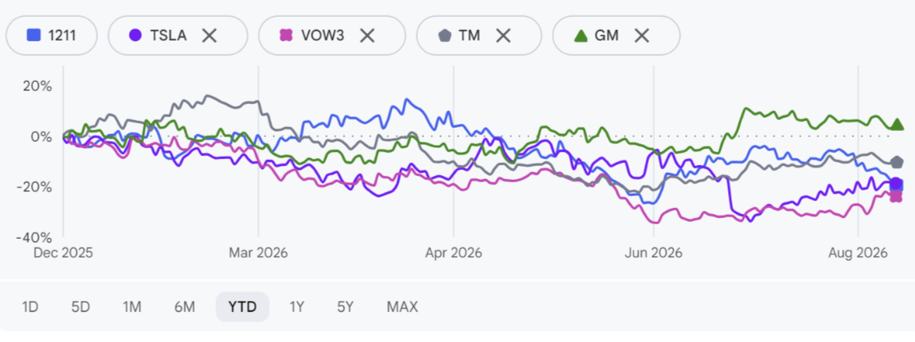
BYD vs selected major global OEMs, YTD to 10 Sept 2026. Source: Google
Verdict: BYD remains the most promising long-term play on the global BEV megatrend, but profitability will need careful monitoring
Our modus operandi for the Energized Portfolio is to take a very long-term view, assuming we may hold investments for up to a decade. In our view, as a vertically integrated supplier with ever stronger access to global markets, BYD has a great opportunity to establish itself as the leading supplier in a tripling of the global EV market over that period. That is the core rationale for its inclusion as a core electrification play in the portfolio.
To help focus the mind, back in November 2025 we dipped our toe into a small position in BYD at HKD 100/share: a bit of skin in the game to nudge us into tackling the investment story more deeply. Admittedly, our timing was poor, just as the Chinese market slowdown started weighing on the shares. The following quarter, 1Q26, was hit by weaker market conditions (partly due to seasonal policy effects) and a spike in FX costs, while the Blade 2.0 battery upgrade was still ongoing. But if BYD’s investments pay off, that may yet prove to be the sales and profitability nadir. Sales have been recovering through the second and third quarters, as the new more competitive range scales up both domestically and internationally. How strong and sustainable that recovery will be, and when the market will start to recognise it, remains to be seen.
On that basis, in mid-September, with the forward P/E down to ~13x from 17-19x in early 2026, we added to our position, before what should be better revenue and earnings numbers land for 3Q26 and FY2026. Tactically, so long as the thesis holds, further share price weakness may offer the opportunity to average down and aggregate a more material long-term position. As the car market does appear quite seasonal, decent 1Q27 numbers would particularly enhance our confidence levels.
Clearly, in such a competitive space, BYD’s international BEV leadership cannot be taken for granted. The key risk is long-term global oversupply weighing on international margins amid intensifying (domestic and international) competition and protectionist headwinds in key target markets, alongside a slower Chinese market. High oil and refined products prices should be a tailwind for EV growth, but alongside this lurks the spectre of broad collateral damage of an AI bubble burst. So this is definitely no “set-and-forget” - it will need careful monitoring to see if the thesis actually plays out as expected.
Key industry and company-specific data points we’ll be watching over the year ahead include:
Chinese car market: absolute sales and relative shares of BEV vs PHEV vs ICE
Likewise for adoption rates and absolute numbers in key international markets
BYD’s domestic market share and profit margins
BYD domestic vs international sales - absolute numbers and relative shares
Sales numbers for newer models
Completion of Blade 2.0 reconfiguration, full ramp-up of new plants in Brazil, Indonesia, inauguration of the Hungary plant, and investment decisions on any further plants
Roll-out of flash-charging infrastructure vs stated targets
Operating and net margins, and net debt position, particularly through 4Q26 and 1Q27 (the first quarter is typically the weakest every year)
Trading multiples (P/E, EV/EBITDA) relative to prior periods and peer group
FX exposure as the ratio of international sales increases
Potential further dilution given the capex cycle and higher leverage
And longer-term, delivery of new shipping export capacity linking BYD’s Chinese output to global markets